Kingston SSDNow V+100 Review
by Anand Lal Shimpi on November 11, 2010 3:05 AM EST- Posted in
- Storage
- SSDs
- Kingston
- SSDNow V+100
I'm not sure what it is about SSD manufacturers and overly complicated product stacks. Kingston has no less than six different SSD brands in its lineup. The E Series, M Series, SSDNow V 100, SSDNow V+ 100, SSDNow V+ 100E and SSDNow V+ 180. The E and M series are just rebranded Intel drives, these use Intel's X25-E and X25-M G2 controllers respectively with Kingston logo on the enclosure. The SSDNow V 100 is an update to the SSDNow V Series drives, both of which use the JMicron JMF618 controller. Don't get this confused with the 30GB SSDNow V Series Boot Drive which actually uses a Toshiba T6UG1XBG controller, also used in the SSDNow V+. Confused yet? It gets better.


The standard V+ is gone and replaced by the new V+ 100, which is what we're here to take a look at today. This drive uses the T6UG1XBG controller but with updated firmware. The new firmware enables two things: very aggressive OS-independent garbage collection and higher overall performance. The former is very important as this is the same controller used in Apple's new MacBook Air. In fact, the performance of the Kingston V+100 drive mimics that of Apple's new SSDs:
| Apple vs. Kingston SSDNow V+100 Performance | ||||||
| Drive | Sequential Write | Sequential Read | Random Write | Random Read | ||
| Apple TS064C 64GB | 185.4 MB/s | 199.7 MB/s | 4.9 MB/s | 19.0 MB/s | ||
| Kingston SSDNow V+100 128GB | 193.1 MB/s | 227.0 MB/s | 4.9 MB/s | 19.7 MB/s | ||
Sequential speed is higher on the Kingston drive but that is likely due to the size difference. Random read/write speed are nearly identical. And there's one phrase in Kingston's press release that sums up why Apple chose this controller for its MacBook Air: "always-on garbage collection". Remember that NAND is written to at the page level (4KB), but erased at the block level (512 pages). Unless told otherwise, SSDs try to retain data as long as possible because to erase a block of NAND usually means erasing a bunch of valid as well as invalid data and then re-writing the valid data again to a new block. Garbage collection is the process by which a block of NAND is cleaned for future writes.
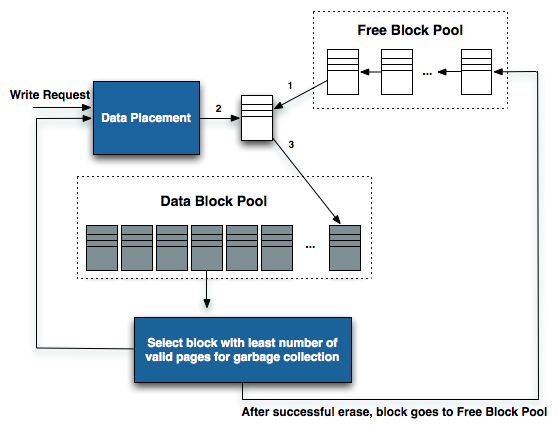
Diagram inspired by IBM Zurich Research Laboratory
If you're too lax with your garbage collection algorithm then write speed will eventually suffer. Each write will eventually have a large penalty associated with it, driving write latency up and throughput down. Too aggressive with garbage collection and drive lifespan suffers. NAND can only be written/erased a finite number of times, aggressively cleaning NAND before it's absolutely necessary will keep write performance high at the expense of wearing out NAND quicker.
Intel was the first to really show us what realtime garbage collection looked like. Here is a graph showing sequential write speed of Intel's X25-V:
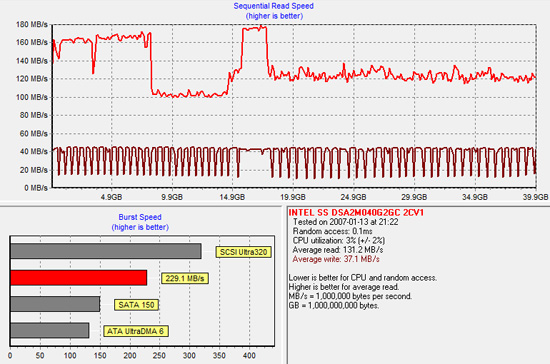
The almost periodic square wave formed by the darker red line above shows a horribly fragmented X25-V attempting to clean itself up at every write. Eventually, with enough writes, the X25-V will return to peak performance. At every write request the X25-V controller will attempt to clean some blocks and return to peak performance. The garbage collection isn't seamless but it will eventually restore performance.
Now look at Kingston's SSDNow V+100, both before fragmentation and after:
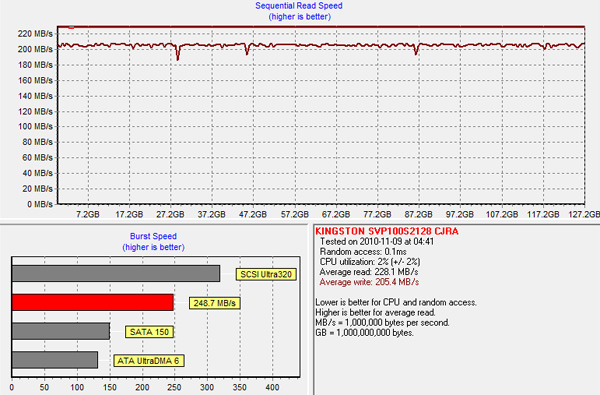
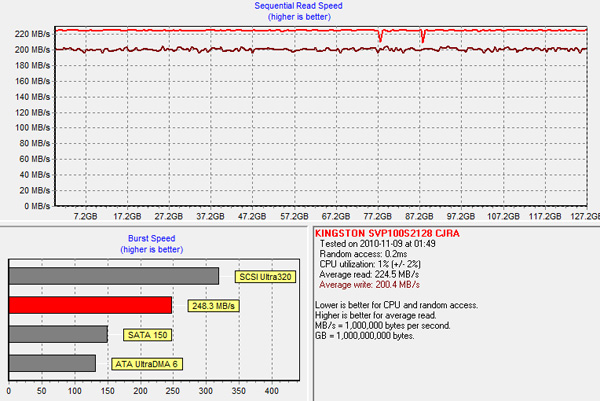
There's hardly any difference. Actually the best way to see this in work is to look at power draw when firing random write requests all over the drive. The SSDNow V+100 has wild swings in power consumption during our random write test ranging from 1.25W to 3.40W. The swings would happen several times in a window of a couple of seconds. The V+100 is aggressively tries to reorganize writes and recycle bad blocks, more aggressively than we've seen from any other SSD.
The benefit of this is you get peak performance out of the drive regardless of how much you use it, which is perfect for an OS without TRIM support - ahem, OS X. Now you can see why Apple chose this controller.
There is a downside however: write amplification. For every 4KB we randomly write to a location on the drive, the actual amount of data written is much, much greater. It's the cost of constantly cleaning/reorganizing the drive for performance. While I haven't had any 50nm, 4xnm or 3xnm NAND physically wear out on me, the V+100 is the most likely to blow through those program/erase cycles. Keep in mind that at the 3xnm node you no longer have 10,000 cycles, but closer to 5,000 before your NAND dies. On nearly all drives we've tested this isn't an issue, but I would be concerned about the V+100. Concerned enough to recommend running it with 20% free space at all times (at least). The more free space you have, the better job the controller can do wear leveling.


96 Comments
View All Comments
Dorin Nicolaescu-Musteață - Thursday, November 11, 2010 - link
Anand, what about the Samsung 470 Series?It's been out since August and looks like a very nice drive. Why in the world the reviews have only started to appear this week on-line.
Nickel020 - Thursday, November 11, 2010 - link
Thanks for the review! I've got a few suggestionss/questions though.I've been out of the loop for a while and looking at Sandforce and other newer drives. So some Sandforce drives have the I/O limitations that were intended for the SF-1200 and some have SF-1500 like performance?
I'm surprised the Corsair F40 does so well. I thought the lower capacity drives performed worse than the 120GB versions, but it holds up really well. Or is this just a special case with the 40GB one and the 60GB is worse than the 40GB one? The 60GB Sandforce are also much better value than the 40GB ones, 50% more capacity at >20% more price. I find it strange you didn't include them and mentioned the 64GB C300 to be the value drive at their price point.
I'm pretty sure the Indilinx 60GB, the unlocked SF-1200 60GB and the X25-M 80GB are the most popular drives out there, which makes them great reference points, but they're not in the review. The former two are not on Bench either unfortunately. Do you have some around and could test them?
You tested the Crucial drives on the ICH10R, right?
Also, I would appreciate some blog posts or small articles about developments with newer FWs. I remember the FW development improving the Indilinx drives significantly, and am always wondering how accurate your older reviews still are given there are newer FWs out now. It would also be nice if you could list the tested FW version in Bench.
It would also be great if you could look at SSD performance in Macbooks. I want to put one in my Macbook Pro (Late 2008), but all the talk of freezing has me hesitating, and I haven't seen an in-depth look at this issue. Is it related to what kind of SSD you use, and does it make a difference wheter you have a late 2008 or mid 2009? It would also be interesting to see how tha lack of TRIM actually affects different drives under OSX.
That's all for now, thanks again!
retnuh - Thursday, November 11, 2010 - link
I've had a OWC Mercury Extreme Pro 240GB in my late 2008 MBP since may, not one issue or freezing. Best upgrade you can do.http://eshop.macsales.com/shop/internal_storage/Me...
iwod - Thursday, November 11, 2010 - link
I posted and asked on many forums and did not found an answer to my MBA ( Macbook Air ) question.Why did the MBA do so well in its test, while its performance data were below the King of SSD controller, Sandforce?
No one could answer. There were number of review pointing out that their MBA actually feels snappier then their Macbook with Sandforce or Intel SSD. Although this is impossible when first heard, numerous other review site seems to confirm similar findings. Of cause there is no way to test it out since the MBA does not have an regular SATA slot.
Now this article actually print out the truth. The same Toshiba SSD controller used in MBA's SSD, is top of the chart in BOTH Synthetic Benchmarks and Real World usage ( Anand Bench ) Benchmarks. What we have been talking as the Holy Grail of SSD Performance Delta, the 4K Random Read / Write, didn't matter when Toshiba was literally the bottom of the chart in those test.
There is a reason why Apple choose a Inferior part ( To us at the time ) instead of Sandforce. The argument for choosing it because of always On GC doesn't make sense, since Sandforce has the same capabilities within the Firmware itself.
One reason would be Toshiba is a NAND manufacture itself, and buying NAND and Controller directly from Toshiba would be cheaper. The other reason being Toshiba ( properly involve Sandisk as well since their JV ) had a controller chip which is very fast.
There has to be an missing pieces in our performance test, something that these companies knows and we dont.
Chloiber - Thursday, November 11, 2010 - link
I'd like to see more real world tests - and I don't consider the AnandTech Storage Bench to be "real world" - it's still a bench, like PCMark.But yes, you are right: synthetic tests tell us little about the performance you actually get from an SSD. There are more unknown variables than we think.
You may see big differences in benches like SysMark or PCMark - and even bigger differences in synthetic tests like AS SSD or even IOMeter. But these scores tell us little about REAL world performance - and with REAL I mean things like:
- "How long does it take to start Photoshop while running Virus Scan?"
- "How long does it take to start iTunes while unzipping a not-so-much-compressed zip-file?"
That's the things I care about. And interestingly, you often get COMPLETELY different results, than what you would think when looking at synthetic tests or "half-synthetic"-tests like PCMark or AnandTech Storage Bench.
Anand Lal Shimpi - Thursday, November 11, 2010 - link
I used to run a lot of those types of tests, however I quickly found that if you choose your iometer and other benchmarks appropriately they don't any new data. And often times they are so limited in their scope (e.g. launch an application with virus scan in the background) that you don't see any appreciable differences between drives. Most high end SSDs are fast enough to do most of these types of tasks just as quickly as one another. It's when you string a bunch of operations together and look for cumulative differences in response time or performance that you can really begin to see which one is faster. These types of scenarios are virtually impossible to perform with consistency by hand, that's where our test suite comes in.AnandTech Storage Bench, PCMark and even SYSMark do what is necessary - they measure performance of a more complex usage case. PCMark Vantage is a great showcase of truly light workload I/O performance, while SYSMark is more CPU bound and shows you how small the differences can be. Our own benchmark offers a more modern set of usage models (we actually do run photoshop while virus scan is active and actually edit images in photoshop, all while doing other things as well).
All of these tests are application based, they are simply scripted or isolate the I/O component specifically. They give us a look into bursts of activity that's, again, near impossible to reproduce by hand with a stopwatch.
Benchmarking a specific task usually just repeats some information we've already presented, fails to present the bigger picture or shows no repeatable difference between drives. I can absolutely add those types of benchmarks back in, however I originally pulled them out because I believed they didn't add anything appreciable to the reviews.
Of course this is your site, if you guys would like me to present some of that data I definitely can :)
Take care,
Anand
Nickel020 - Thursday, November 11, 2010 - link
The problem is that the synthetic tests you do are hard to interpret for just about anyone. "What drive is the best for this usage profile?" is still really hard to answer after reading your reviews (not that anyone else does a better job).And even if there is little difference between todays drives in the level loading time tests you used to do, we don't know that even if you do. Right now the average AT reader reads this test and doesn't know that the more expensive drives won't load his games noticeably faster or perform better when doing video editing.
Maybe you should give recommendations for certain usage profiles, like video editing, photo editing, gaming etc. Even if you're just saying that there's not gonna be a noticeable difference.
wumpus - Thursday, November 11, 2010 - link
It might help if you included statements like "you don't see any appreciable differences between drives. Most high end SSDs are fast enough to do most of these types of tasks just as quickly as one another." a bit more often in the articles. While we might be interested in the technical data, it would usually be foolish to buy SSDs by things other than size, price, and reliability.Chloiber - Saturday, November 13, 2010 - link
But that's the thing. You don't see any difference in an application a "normal" homeuser would use. We see huge differences in those synthetic tests, but in reality, you don't have any faster loading time.Of course you can test it like this and say:
"You don't see much difference between these three SSDs in "real world" application tests. Get the cheapest SSD (or most robust, whatever)."
Or another position (I think the one you are currently in) is:
"You don't see much difference between these three SSDs in "real world" application tests so let's stress them some more and base our verdict on those stresstests."
The thing is:
a) You don't know how the SSDs would REALLY react if you stress them in reality like this. They are still synthetic tests and unless you can prove that there are scenarios where differences appear (without any influence of some kind of bench program) they don't tell us that much.
b) I think we have to begin to widen our horizon a little bit. Why exactly is it, that you don't see any beneftit using a, let's say, 50k IOPS drive and a 15k IOPS drive? Shouldn't you see some significant faster load times?
Im telling you this because of future SSDs. We get 30k IOPS, soon 60k IOPS, and in one year maybe over 100k IOPS. The score in your benches gets bigger and bigger...and bigger...
And what exactly is it the user gets? NOTHING because everything else in his computer is limiting his SSD (which is already happening right now!)!
I agree that you have to test hardware in scenarios, where nothing else is limiting your subject. That's why you use a 4GHz i7 when testing GPUs. That's why you test CPUs game performance using a very low resolution.
But I think it's really important that you also test scenarios a user experiences in reality. And that means in this case: "real world" benches. And yes, there will be nearly no difference there. But isn't this the thing I want to know? If I spend 600$ on a fking RevoDrive and nothing loads faster, I WANNA KNOW ABOUT IT!
I hope you see my point :)
Out of Box Experience - Thursday, November 11, 2010 - link
Real World testing of SSD's should be done in a worst case scenaio on the lowest common denominatorThey should be plug and play on XP machines without any tweaks on the slowest computer you use to amplify the differences between drives
I use a copy/paste test on ATOM CPU's to guage the Real World differences between Platter drives and SSD's
Using 200MB of data (900+ files in 80 or so folders), I simply time a copy/paste of that data on the ATOM computer
Using a faster computer WILL reduce the "Relative" speed gap between drives to the point where it becomes hard to tell which of two drives is actually the fastest
Using Windows 7 with its funky caching scheme will make ALL the drives appear to copy and paste at the same speed on the ATOM core and therefore cannot be used for this test
A 40GB Vertex 2 can copy and paste this data in 55 seconds (3.6MB/sec)
A 5400RPM Western Digital Laptop drive does it in 54 seconds
A 7200RPM Western Digital Desktop Drive takes 17 seconds
ALL testing was done under XP-SP2 without ANY tweaks!
All tests were repeated for accuracy
Sandforce SSD's are HORRIBLE at handling data that is NOT compressible or that is already on the drive in compressed form
Any drive that requires Windows 7 or multiple tweaks just to give you "Synthetic" numbers that have no bearing in the Real World are worthless
Show us how they compare in a worst case scenario on the least common denominator for results we can use please
I'm tired of hearing how great Sandforce drives are when they can't even beat a 5400RPM laptop drive in a Real World test such as the one I've just described