Samsung T5 EVO Portable SSD Review: QLC Sets Sane Expectations, Insane Pricing
by Ganesh T S on November 14, 2023 10:00 AM EST- Posted in
- Storage
- SSDs
- Samsung
- USB 3.0
- flash
- DAS
- Type-C
- External SSDs
- Portable SSDs
Performance Benchmarks
Benchmarks such as ATTO and CrystalDiskMark help provide a quick look at the performance of the direct-attached storage device. The results translate to the instantaneous performance numbers that consumers can expect for specific workloads, but do not account for changes in behavior when the unit is subject to long-term conditioning and/or thermal throttling. Yet another use of these synthetic benchmarks is the ability to gather information regarding support for specific storage device features that affect performance.
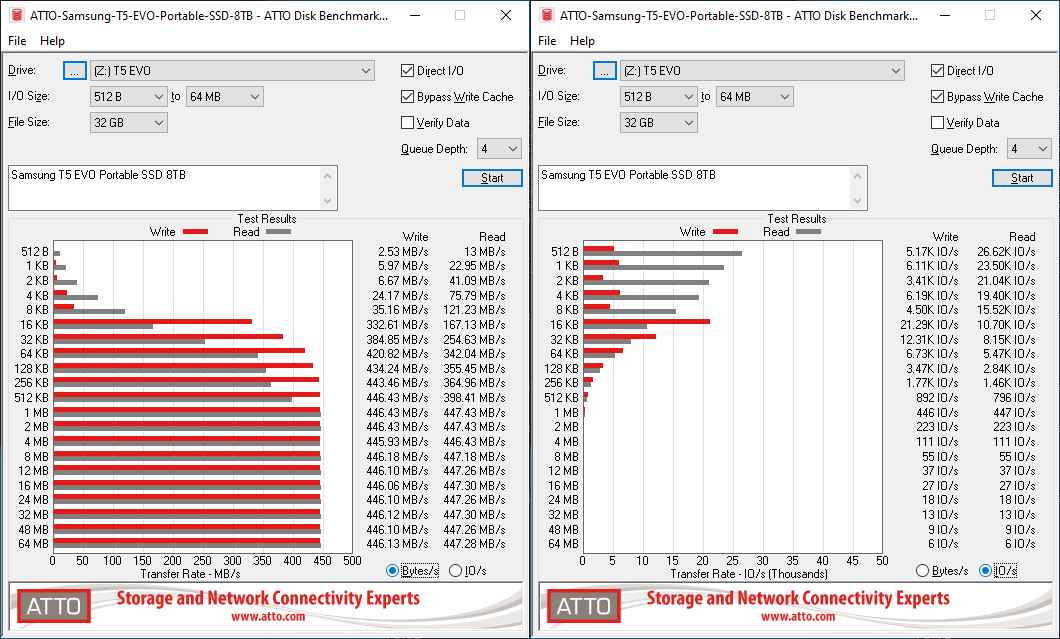
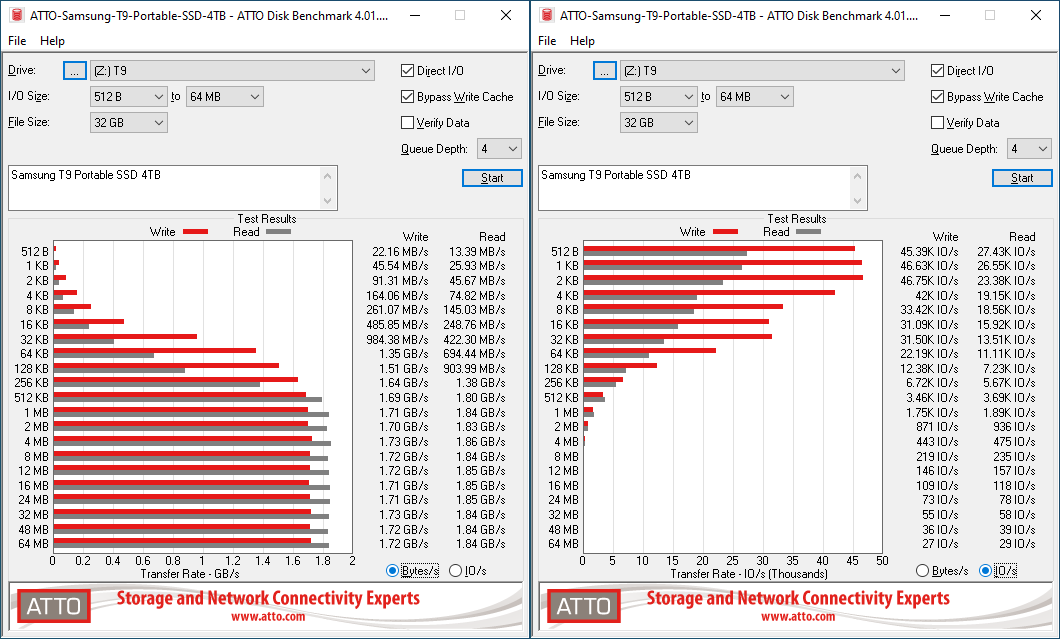
Samsung claims read and write speeds of up to 460 MBps for the 8TB variant of the T5 EVO. We do get numbers close to those (446 MBps) in the ATTO benchmarks presented below. Our ATTO benchmarking is restricted to a single configuration in terms of queue depth, and is only representative of a small sub-set of real-world workloads. The results also allow the visualization of change in transfer rates as the I/O size changes, with optimal performance being reached around 1 MB for a queue depth of 4.
| ATTO Benchmarks | |
| TOP: | BOTTOM: |
 |
|
 |
|
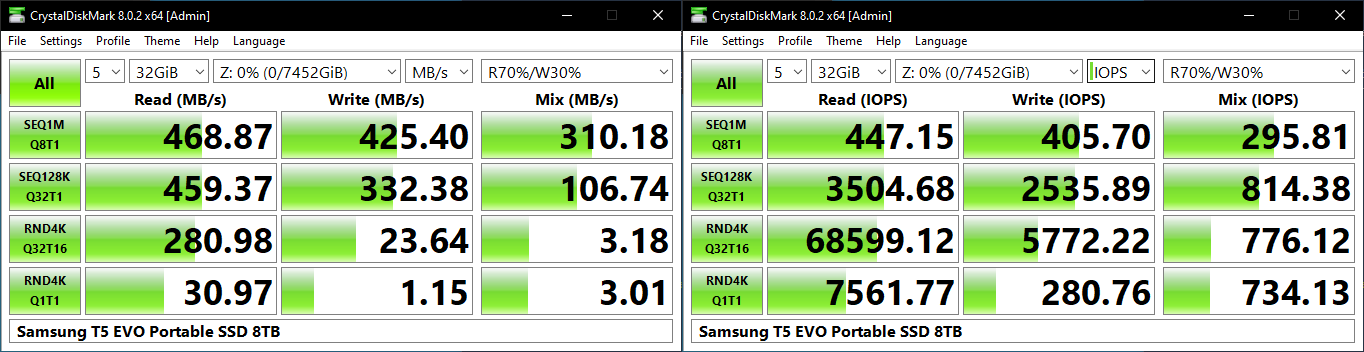
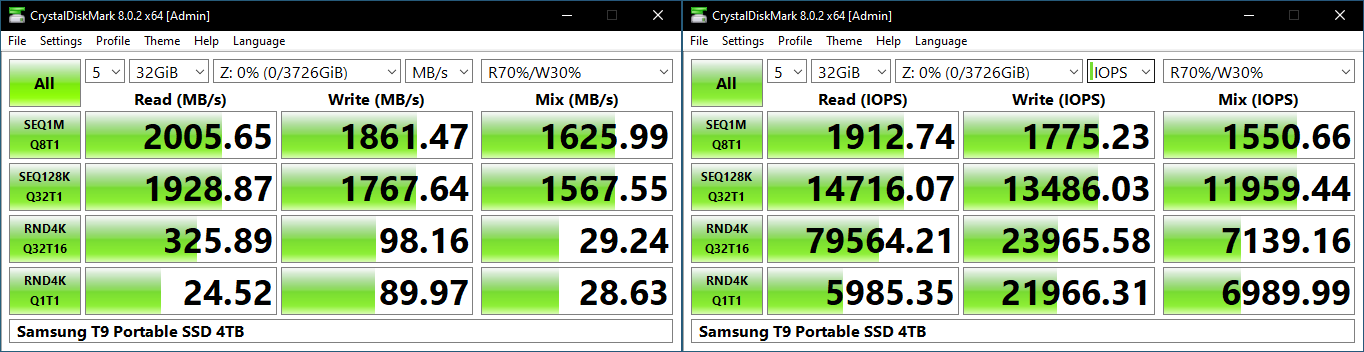
CrystalDiskMark. for example, uses four different access traces for reads and writes over a configurable region size. Two of the traces are sequential accesses, while two are 4K random accesses. Internally, CrystalDiskMark uses the Microsoft DiskSpd storage testing tool. The 'Seq128K Q32T1' sequential traces use 128K block size with a queue depth of 32 from a single thread, while the '4K Q32T16' one does random 4K accesses with the same queue configuration, but from multiple threads. The 'Seq1M' traces use a 1MiB block size. The plain 'Rnd4K' one uses only a single queue and single thread . Comparing the '4K Q32T16' and '4K Q1T1' numbers can quickly tell us whether the storage device supports NCQ (native command queuing) / UASP (USB-attached SCSI protocol). If the numbers for the two access traces are in the same ballpark, NCQ / UASP is not supported. This assumes that the host port / drivers on the PC support UASP.
| CrystalDiskMark Benchmarks | |
| TOP: | BOTTOM: |
 |
|
 |
|
Typical of QLC SSDs, the random write performance is quite weak. However, the random read numbers are excellent. Thanks to the availability of dedicated DRAM for the FTL, the random read performance at low queue depths for the T5 EVO is actually better than that of the DRAM-less T7 Shield. Sequential numbers are limited by the host interface.
AnandTech DAS Suite - Benchmarking for Performance Consistency
Our testing methodology for storage bridges / direct-attached storage units takes into consideration the usual use-case for such devices. The most common usage scenario is transfer of large amounts of photos and videos to and from the unit. Other usage scenarios include the use of the unit as a download or install location for games and importing files directly from it into a multimedia editing program such as Adobe Photoshop. Some users may even opt to boot an OS off an external storage device.
The AnandTech DAS Suite tackles the first use-case. The evaluation involves processing five different workloads:
- AV: Multimedia content with audio and video files totalling 24.03 GB over 1263 files in 109 sub-folders
- Home: Photos and document files totalling 18.86 GB over 7627 files in 382 sub-folders
- BR: Blu-ray folder structure totalling 23.09 GB over 111 files in 10 sub-folders
- ISOs: OS installation files (ISOs) totalling 28.61 GB over 4 files in one folder
- Disk-to-Disk: Addition of 223.32 GB spread over 171 files in 29 sub-folders to the above four workloads (total of 317.91 GB over 9176 files in 535 sub-folders)
Except for the 'Disk-to-Disk' workload, each data set is first placed in a 29GB RAM drive, and a robocopy command is issue to transfer it to the external storage unit (formatted in exFAT for flash-based units, and NTFS for HDD-based units).
robocopy /NP /MIR /NFL /J /NDL /MT:32 $SRC_PATH $DEST_PATH
Upon completion of the transfer (write test), the contents from the unit are read back into the RAM drive (read test) after a 10 second idling interval. This process is repeated three times for each workload. Read and write speeds, as well as the time taken to complete each pass are recorded. Whenever possible, the temperature of the external storage device is recorded during the idling intervals. Bandwidth for each data set is computed as the average of all three passes.
The 'Disk-to-Disk' workload involves a similar process, but with one iteration only. The data is copied to the external unit from the CPU-attached NVMe drive, and then copied back to the internal drive. It does include more amount of continuous data transfer in a single direction, as data that doesn't fit in the RAM drive is also part of the workload set.
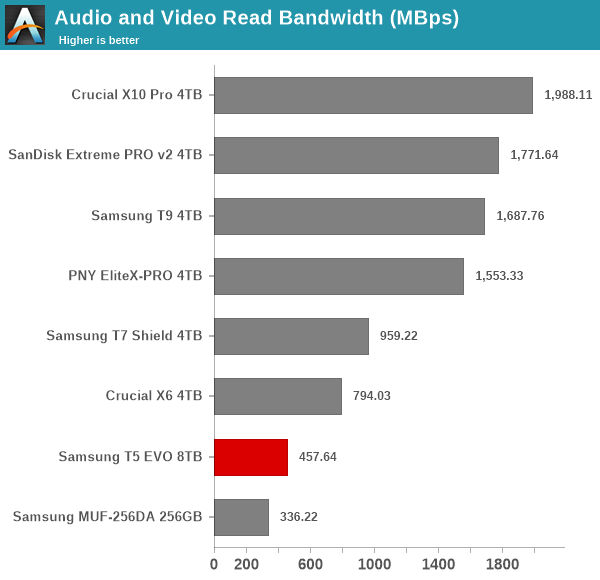
Across all of these workloads, the T5 EVO performs slightly better in the reads and much better in the writes compared to the only other USB 3.2 Gen 1 device in our results database - a USB flash drive. Other drives with better host interfaces / internal TLC SSDs deliver higher bandwidth numbers for these use-cases, as per expectations. Power users may want to dig deeper to understand the limits of each device. To address this concern, we also instrumented our evaluation scheme for determining performance consistency.
Performance Consistency
Aspects influencing the performance consistency include SLC caching and thermal throttling / firmware caps on access rates to avoid overheating. This is important for power users, as the last thing that they want to see when copying over 100s of GB of data is the transfer rate going down to USB 2.0 speeds.
In addition to tracking the instantaneous read and write speeds of the DAS when processing the AnandTech DAS Suite, the temperature of the drive was also recorded. In earlier reviews, we used to track the temperature all through. However, we have observed that SMART read-outs for the temperature in NVMe SSDs using USB 3.2 Gen 2 bridge chips end up negatively affecting the actual transfer rates. To avoid this problem, we have restricted ourselves to recording the temperature only during the idling intervals. The graphs below present the recorded data.
| AnandTech DAS Suite - Performance Consistency | |
| TOP: | BOTTOM: |
 |
|
 |
|
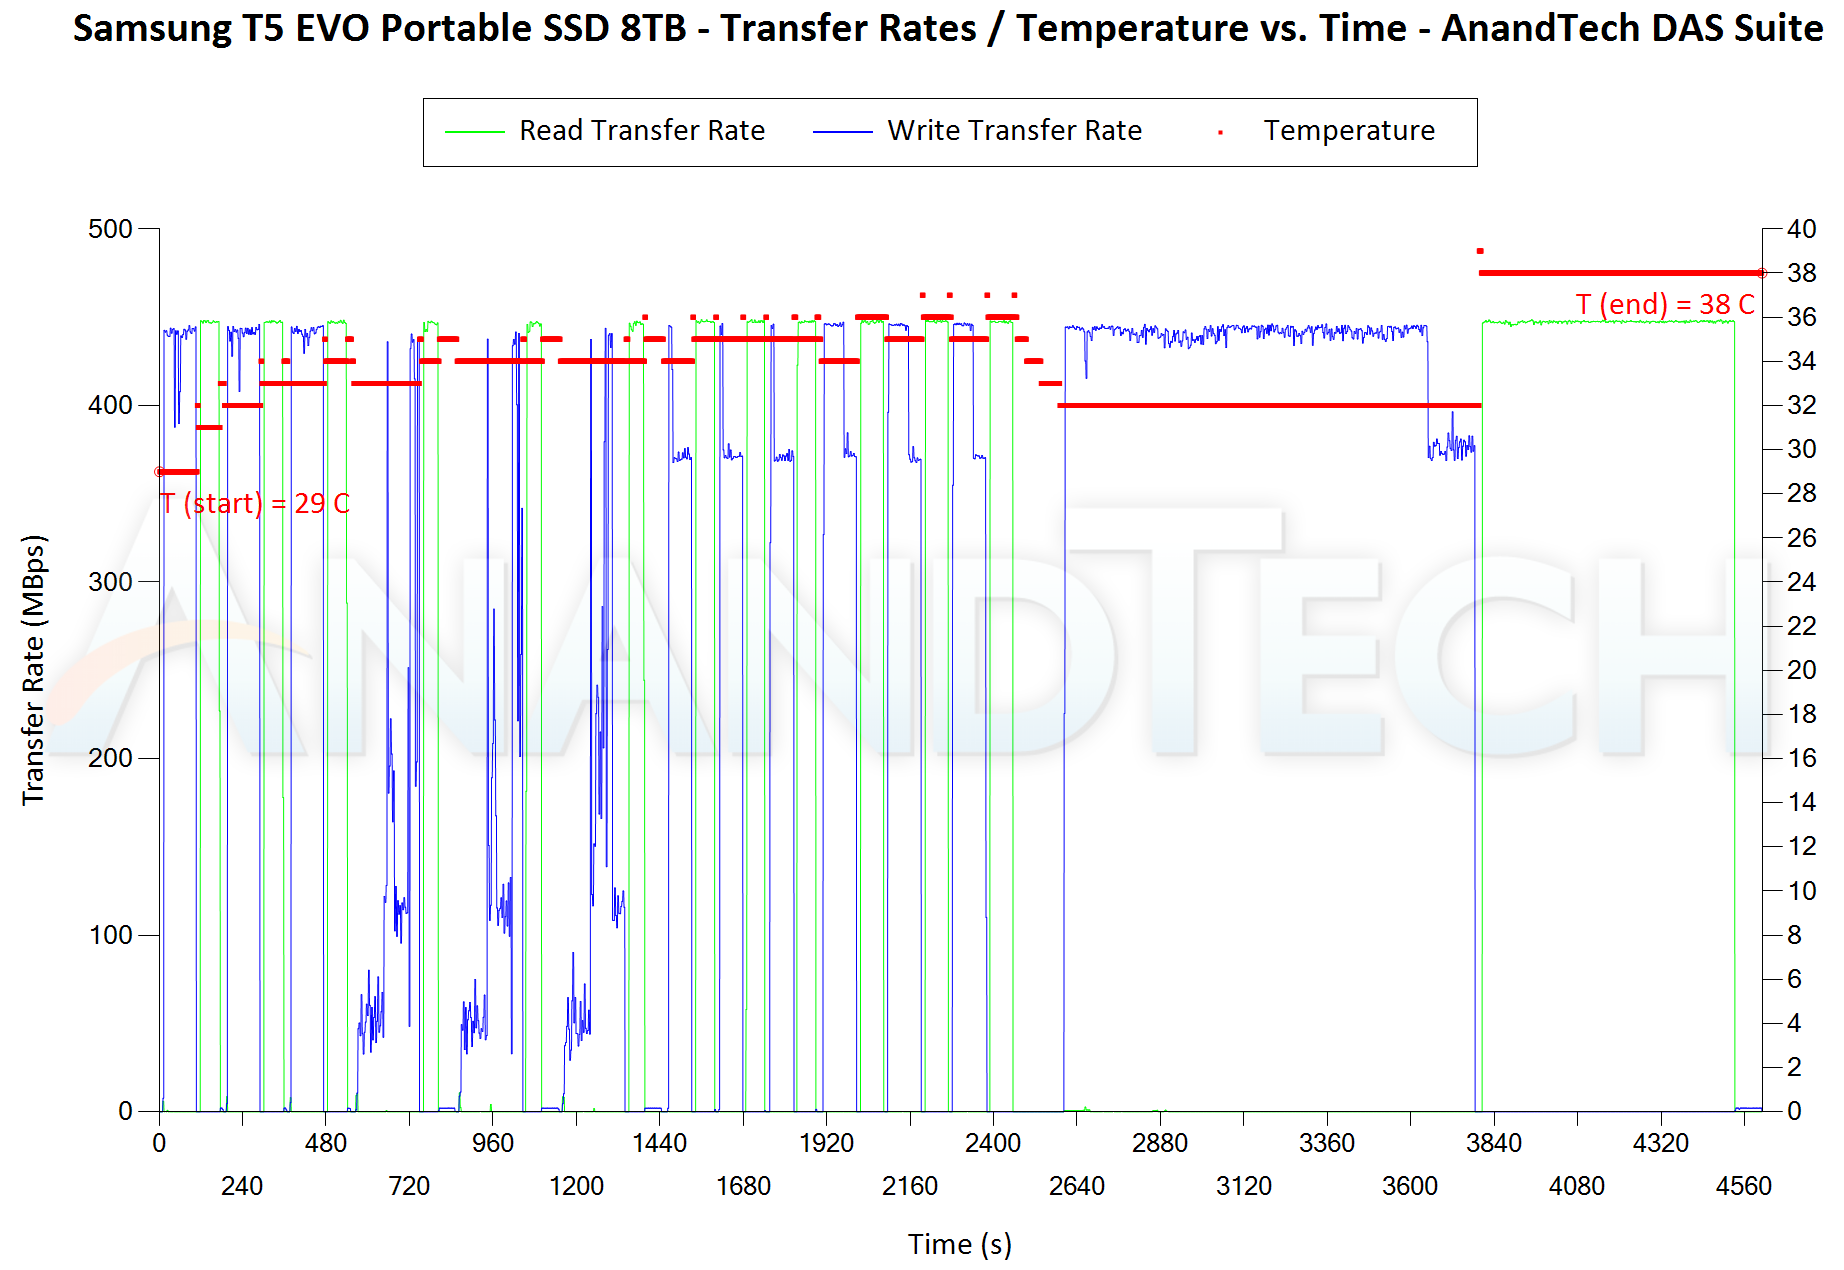
The first three sets of writes and reads correspond to the AV suite. A small gap (for the transfer of the video suite from the internal SSD to the RAM drive) is followed by three sets for the Home suite. Another small RAM-drive transfer gap is followed by three sets for the Blu-ray folder. This is followed up with the large-sized ISO files set. Finally, we have the single disk-to-disk transfer set.
The T5 EVO is able to maintain around 450 MBps consistently for reads and writes when large file sizes are involved. For smaller file sizes, the writes drop down a bit. But, the behavior doesn't seem to be indicative of a SLC cliff that was seen in other PSSDs. While other PSSDs deliver much better raw bandwidth numbers, the loss in performance is much higher after the SLC cache runs out. This may lead to some user frustration - an aspect seemingly well-handled by the QLC configuration in the 8TB T5 EVO. The 38C temperature at the end of the process is also quite reasonable given the performance of the unit.
PCMark 10 Storage Bench - Real-World Access Traces
There are a number of storage benchmarks that can subject a device to artificial access traces by varying the mix of reads and writes, the access block sizes, and the queue depth / number of outstanding data requests. We saw results from two popular ones - ATTO, and CrystalDiskMark - in a previous section. More serious benchmarks, however, actually replicate access traces from real-world workloads to determine the suitability of a particular device for a particular workload. Real-world access traces may be used for simulating the behavior of computing activities that are limited by storage performance. Examples include booting an operating system or loading a particular game from the disk.
PCMark 10's storage bench (introduced in v2.1.2153) includes four storage benchmarks that use relevant real-world traces from popular applications and common tasks to fully test the performance of the latest modern drives:
- The Full System Drive Benchmark uses a wide-ranging set of real-world traces from popular applications and common tasks to fully test the performance of the fastest modern drives. It involves a total of 204 GB of write traffic.
- The Quick System Drive Benchmark is a shorter test with a smaller set of less demanding real-world traces. It subjects the device to 23 GB of writes.
- The Data Drive Benchmark is designed to test drives that are used for storing files rather than applications. These typically include NAS drives, USB sticks, memory cards, and other external storage devices. The device is subjected to 15 GB of writes.
- The Drive Performance Consistency Test is a long-running and extremely demanding test with a heavy, continuous load for expert users. In-depth reporting shows how the performance of the drive varies under different conditions. This writes more than 23 TB of data to the drive.
Despite the data drive benchmark appearing most suitable for testing direct-attached storage, we opt to run the full system drive benchmark as part of our evaluation flow. Many of us use portable flash drives as boot drives and storage for Steam games. These types of use-cases are addressed only in the full system drive benchmark.
The Full System Drive Benchmark comprises of 23 different traces. For the purpose of presenting results, we classify them under five different categories:
- Boot: Replay of storage access trace recorded while booting Windows 10
- Creative: Replay of storage access traces recorded during the start up and usage of Adobe applications such as Acrobat, After Effects, Illustrator, Premiere Pro, Lightroom, and Photoshop.
- Office: Replay of storage access traces recorded during the usage of Microsoft Office applications such as Excel and Powerpoint.
- Gaming: Replay of storage access traces recorded during the start up of games such as Battlefield V, Call of Duty Black Ops 4, and Overwatch.
- File Transfers: Replay of storage access traces (Write-Only, Read-Write, and Read-Only) recorded during the transfer of data such as ISOs and photographs.
PCMark 10 also generates an overall score, bandwidth, and average latency number for quick comparison of different drives. The sub-sections in the rest of the page reference the access traces specified in the PCMark 10 Technical Guide.
Booting Windows 10
The read-write bandwidth recorded for each drive in the boo access trace is presented below.
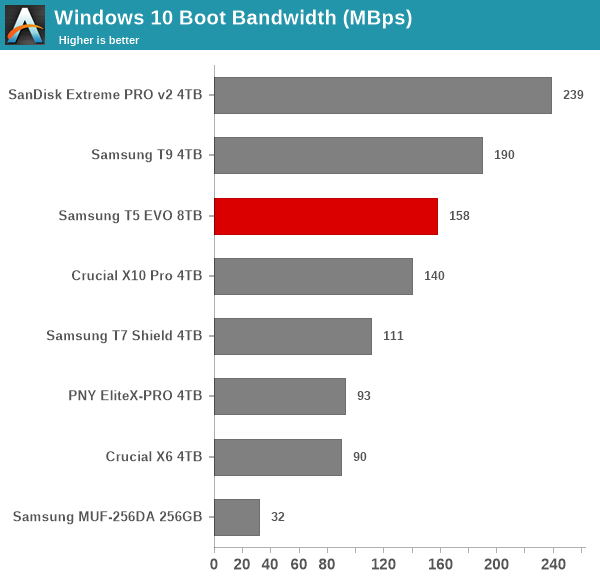
Low queue depth random accesses usually get better performance with DRAM-equipped SSDs, even when they are behind SATA controllers. Hence, it is not much of a surprise to see the T5 EVO outperform even the T7 Shield in this benchmark.
Creative Workloads
The read-write bandwidth recorded for each drive in the sacr, saft, sill, spre, slig, sps, aft, exc, ill, ind, psh, and psl access traces are presented below.
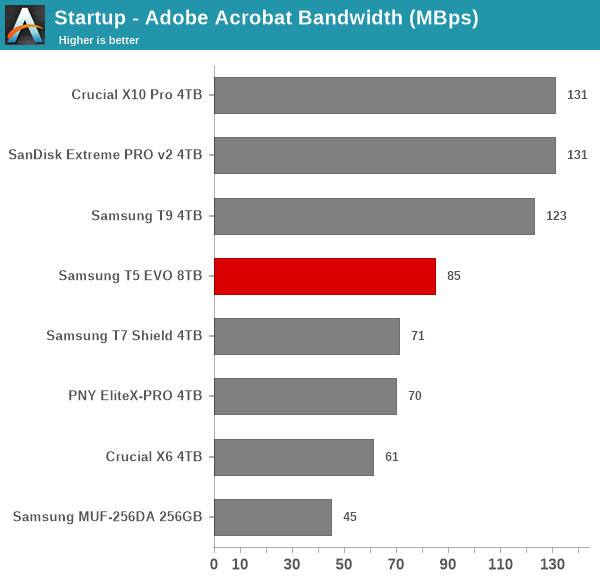
The T5 EVO fares much better for the creative workloads, as many of the traces are sequential in nature. Photoshop does see the T5 EVO getting pushed out to the bottom of the list, but in general, the presence of DRAM on the T5 EVO's main board helps deliver good results.
Office Workloads
The read-write bandwidth recorded for each drive in the exc and pow access traces are presented below.
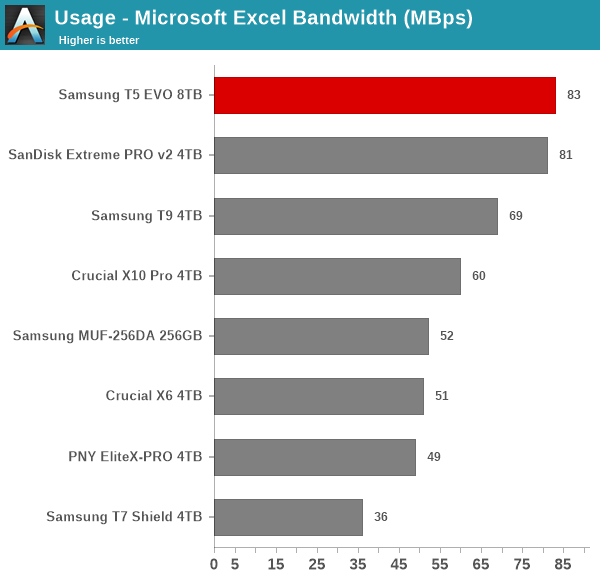
The spreadsheet workload appears to be largely sequential in nature, allowing for the T5 EVO to get top honors. Performance falls down for the presentation workload due to the nature of accesses that have an advantage with faster host interfaces.
Gaming Workloads
The read-write bandwidth recorded for each drive in the bf, cod, and ow access traces are presented below.
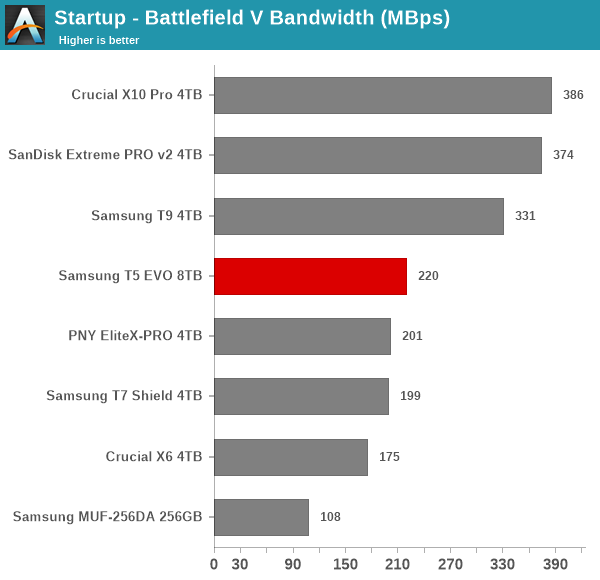
Gaming workloads are usually heavy on sequential reads, allowing the T5 EVO to shine in the middle of the pack, with units able to outperform it only with faster host interfaces.
Files Transfer Workloads
The read-write bandwidth recorded for each drive in the cp1, cp2, cp3, cps1, cps2, and cps3 access traces are presented below.
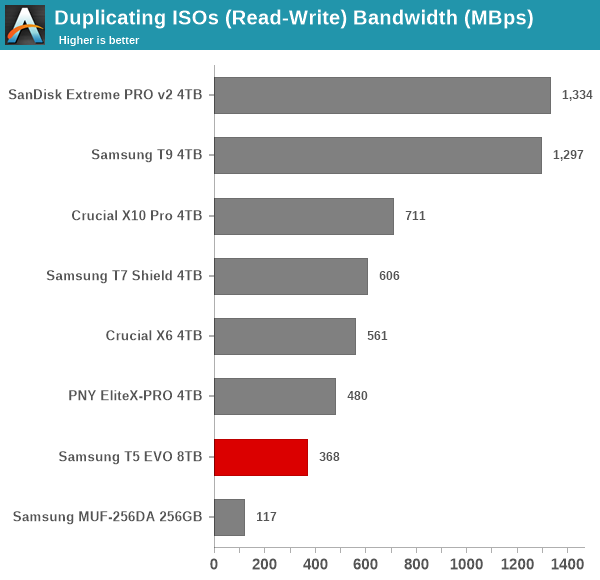
These workloads mirror our DAS test suite, and the results are largely the same. Faster host interfaces backed by high-performance SSDs have a significant advantage. So, it is no surprise that the T5 EVO and the 5 Gbps thumb drive make up the bottom portion of the graphs.
Overall Scores
PCMark 10 reports an overall score based on the observed bandwidth and access times for the full workload set. The score, bandwidth, and average access latency for each of the drives are presented below.
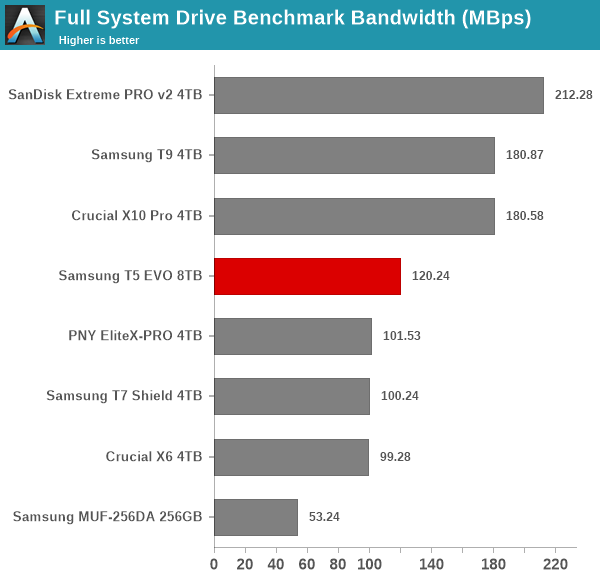
The use of a DRAM-enabled SATA SSD platform allows the Samsung T5 EVO to place itself in the middle of the pack, ahead of even units like the DRAM-less T7 Shield. A faster host interface allows the X10 Pro to outperform the T5 EVO, and the two high-performance SSDs behind USB 3.2 Gen 2x2 bridge chips make up the top two spots.


13 Comments
View All Comments
James5mith - Tuesday, November 14, 2023 - link
"The T5 EVO is able to sustain maximum write speeds (around 440 MBps) for more than three hours"By your own graph, 180 seconds does not equate to 3 hours.
DanNeely - Saturday, November 18, 2023 - link
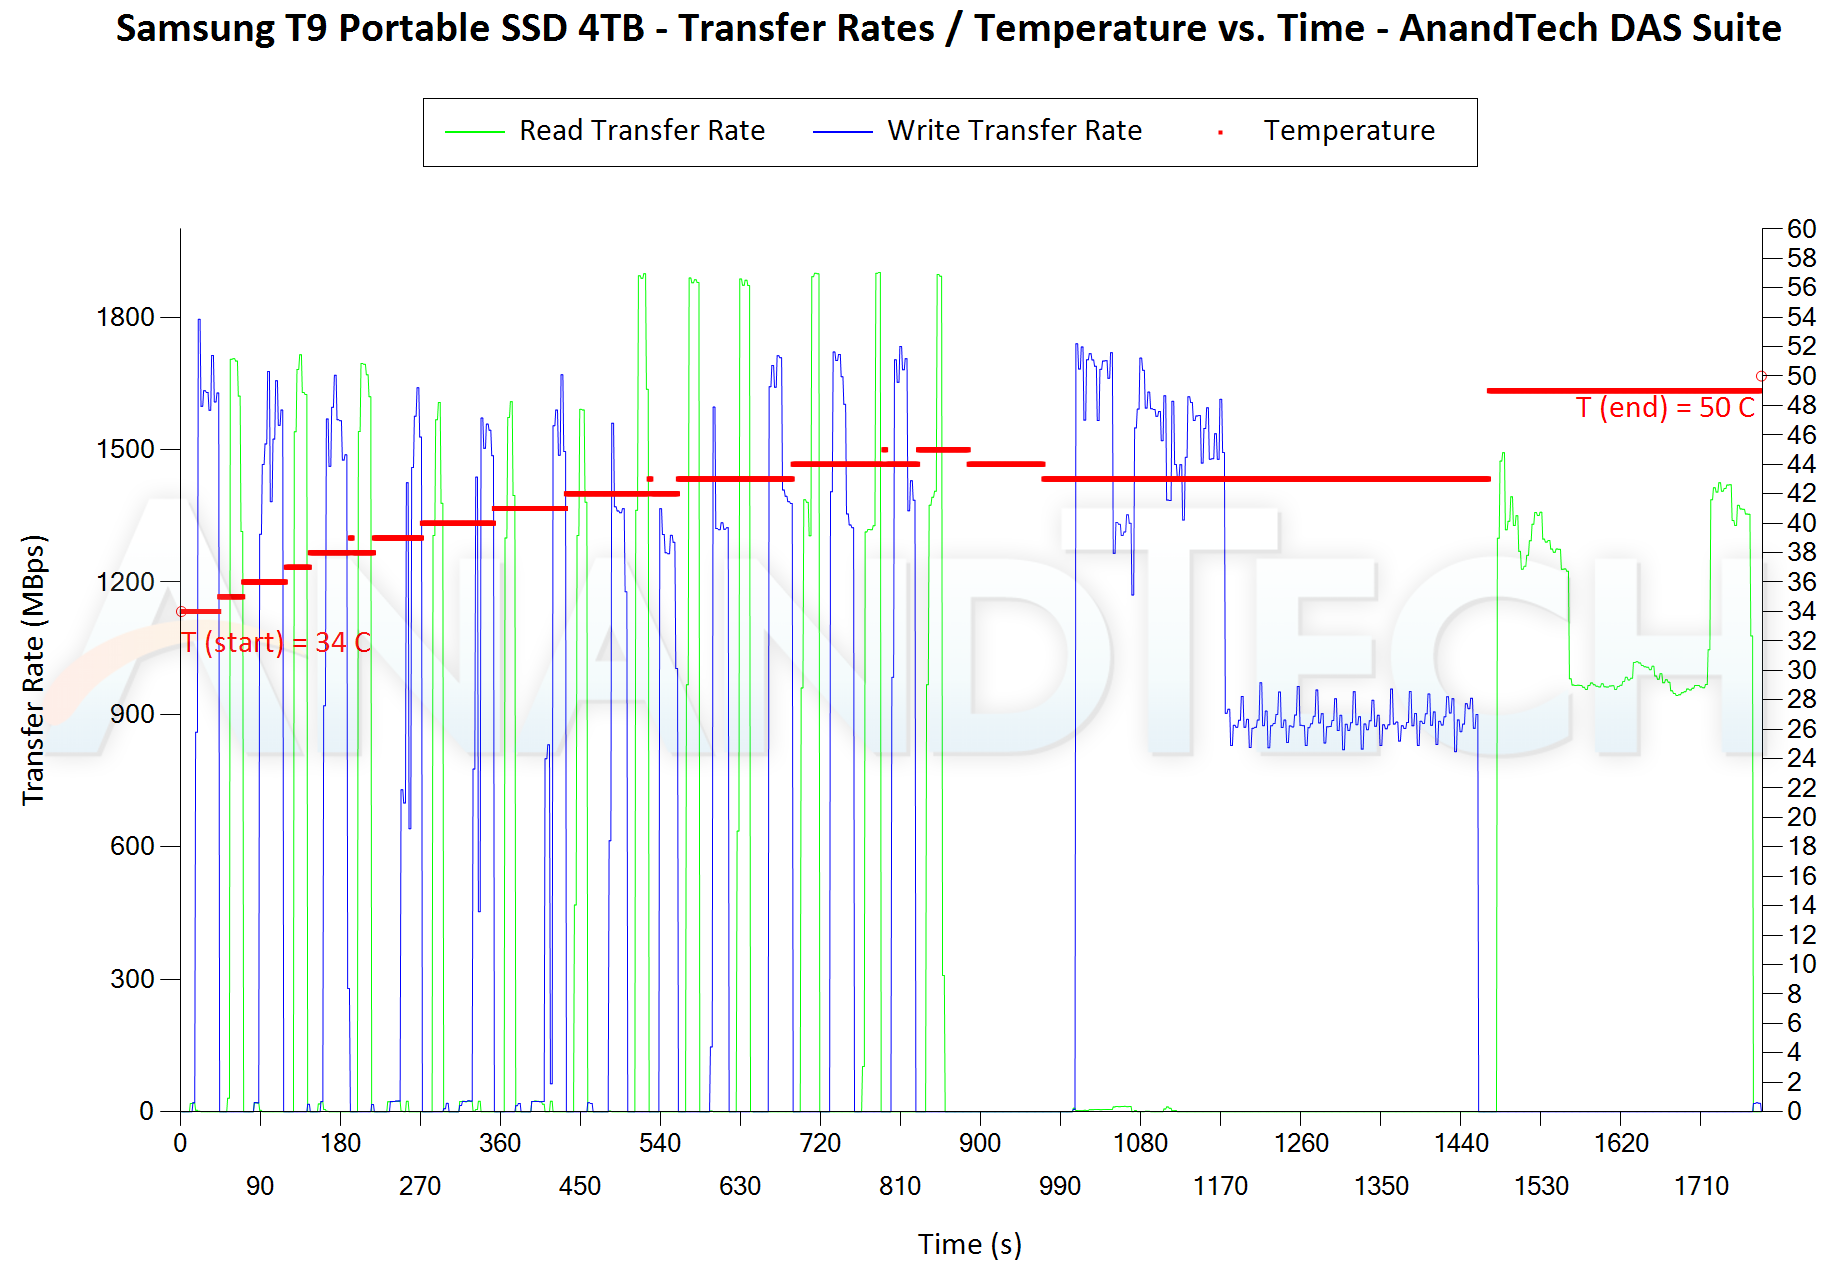
You're looking at the wrong graph. The t5 EVO is the top one in the pair by that comment and sustains the 440MBps speed for ~13000 seconds (3.6 hours). The bottom graph is for the comparison SSD, which sustains ~1700MBps for 3 minutes before falling down to ~900MBps.James5mith - Tuesday, November 14, 2023 - link
Sorry, I guess I was looking at the T9 graph while reading the paragraph. My mistake.GabrielFerrazTPU - Tuesday, November 14, 2023 - link
Hello my name is Gabriel Ferraz i'm the computer engineer responsible for the Techpowerup SSD Database, first of all, great job on the review, just as an insight, i'm not sure which decoder you used on that NAND Flash, but i think it's the newer 176-Layer QLC Die, i didn't see any QLC 128-Layer NAND Flash from Samsung so far. only the 512Gb / 256Gb TLV V6 and the TLC V6P (Prime) 133-Layer 512GbSlash3 - Tuesday, November 14, 2023 - link
The TPU database is a great resource; we appreciate the work that goes into it!GabrielFerrazTPU - Thursday, November 16, 2023 - link
Thank you :)I'm glad you guys liked it
ganeshts - Tuesday, November 14, 2023 - link
Gabriel, Thanks for taking the time to make this observation.I've since confirmed that this flash package is indeed 176L 7th Gen. V-NAND QLC, I have updated the article with necessary strike-throughs to reflect this fact.
GabrielFerrazTPU - Thursday, November 16, 2023 - link
You're Welcome :DBy the way, if you could do me a favor, since i'm from Brazil Samsung don't ship drives here so i can't contact them directly, do you think you could ask them more about their "V6P 133-Layer" line-up? I've recently heard about it a few days ago, but i can't find anything about it.
name99 - Tuesday, November 14, 2023 - link
"However, Samsung is currently selling the PSSD for $650... This is absurd pricing for a QLC PSSD"It's only absurd pricing if there is competition. There ISN'T.
If I want an external 8G SSD drive, what are my options?
- I can buy a QVO and an enclosure -- but most enclosures don't work with an 8TB drive. (More precisely there seems to be some confusion in the spec around 8TB, so for any random combination of 8TB drive, enclosure, PC, and OS, it's random whether it works or not)
- I can buy a VectoTech drive which is, admittedly, cheaper, but probably of weaker performance, especially for large writes.
- Or I can buy an Oyen drive of even more unknown characteristics.
That's it.
The Samsung price will come down when brands that people have actually heard of enter the market. So far, for whatever reason, that simply hasn't happened. No Crucial, no Kingston, no PNY, no Sandisk.
ganeshts - Tuesday, November 14, 2023 - link
Yes, once there is more competition from known brands in the 8TB space, the pricing will come down. But, that doesn't explain why the T9 4TB SKU is currently at $250 in both Best Buy and Amazon, while Samsung wants to charge $350 for the 4TB T5 EVO (on Amazon again).Pricing a QLC PSSD more at the same capacity as a TLC PSSD (with a faster host interface) is absurd. Samsung needs to go back to the drawing board as far as pricing is concerned.