Intel Atlas Canyon (NUC11ATKPE) and GEEKOM MiniAir 11 UCFF PCs Review: Desktop Jasper Lake Impresses
by Ganesh T S on July 14, 2022 8:00 AM ESTSystem Performance: UL and BAPCo Benchmarks
Our 2022 test suite for Windows 11-based systems carries over some of the standard benchmarks we have been using over the last several years, including UL's PCMark and BAPCo's SYSmark. Starting this year, we are also including BAPCo's CrossMark multi-platform benchmarking tool.
PCMark 10
UL's PCMark 10 evaluates computing systems for various usage scenarios (generic / essential tasks such as web browsing and starting up applications, productivity tasks such as editing spreadsheets and documents, gaming, and digital content creation). We benchmarked select PCs with the PCMark 10 Extended profile and recorded the scores for various scenarios. These scores are heavily influenced by the CPU and GPU in the system, though the RAM and storage device also play a part. The power plan was set to Balanced for all the PCs while processing the PCMark 10 benchmark.
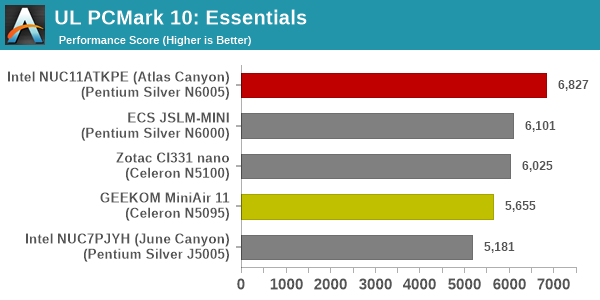
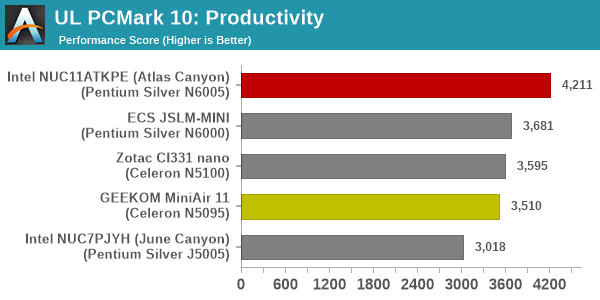
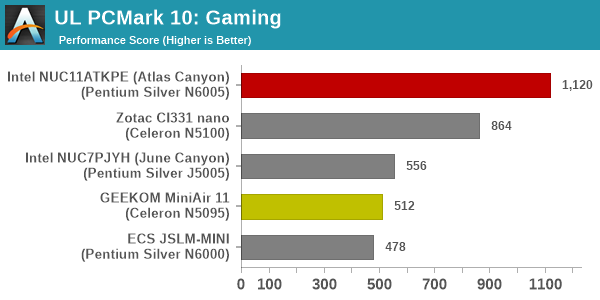
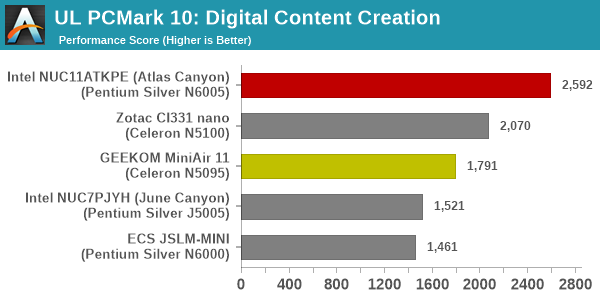
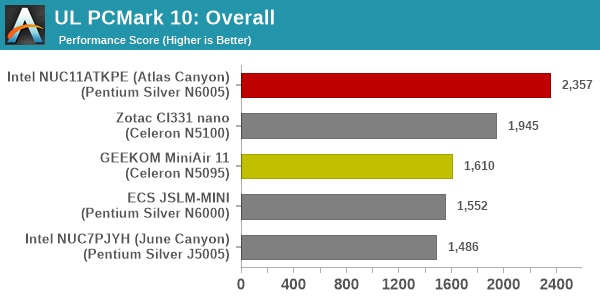
As expected, Atlas Canyon comes out on top in all sections. Not surprising, given that it has the highest PL1 (15W) and PL2 (25W) settings, is equipped with the fastest possible DDR4-2933 RAM in dual-channel configuration, and comes with active cooling. The MiniAir 11 compares favorably against the June Canyon NUC in all except the Gaming component (where it loses out due to a combination of lesser number of EUs in the GPU and lack of dual channel memory). Additionally, it loses out against the CI331 nano consistently and against the JSLM-MINI in the Essentials and Productivity components - again, due to the lack of dual-channel memory.
BAPCo SYSmark 25
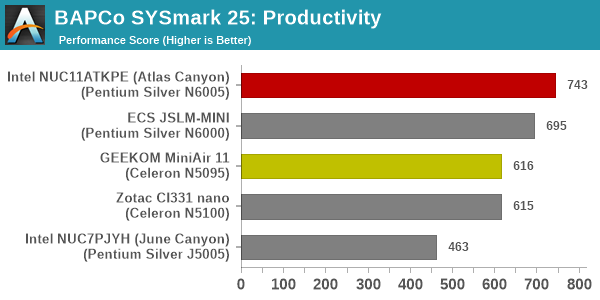
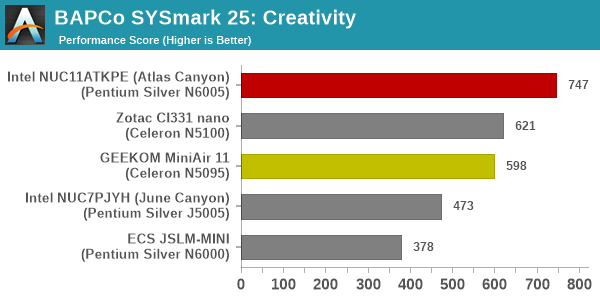
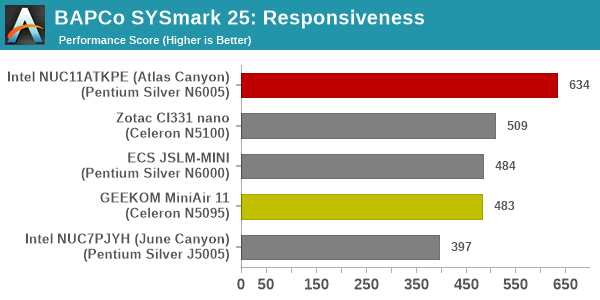
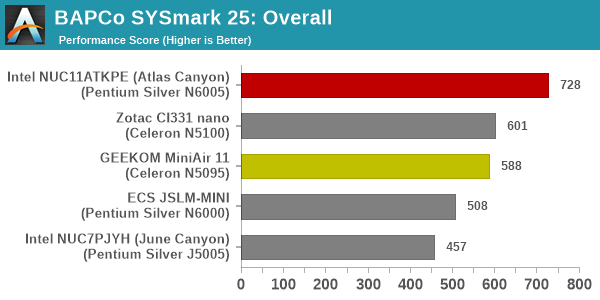
BAPCo's SYSmark 25 is an application-based benchmark that uses real-world applications to replay usage patterns of business users in the areas of productivity, creativity, and responsiveness. The 'Productivity Scenario' covers office-centric activities including word processing, spreadsheet usage, financial analysis, software development, application installation, file compression, and e-mail management. The 'Creativity Scenario' represents media-centric activities such as digital photo processing, AI and ML for face recognition in photos and videos for the purpose of content creation, etc. The 'Responsiveness Scenario' evaluates the ability of the system to react in a quick manner to user inputs in areas such as application and file launches, web browsing, and multi-tasking.
Scores are meant to be compared against a reference desktop (the SYSmark 25 calibration system, a Lenovo Thinkcenter M720q with a Core i5-8500T and 8GB of DDR4 memory to go with a 256GB M.2 NVMe SSD). The calibration system scores 1000 in each of the scenarios. A score of, say, 2000, would imply that the system under test is twice as fast as the reference system.
SYSmark 25 also adds energy measurement to the mix. A high score in the SYSmark benchmarks might be nice to have, but potential customers also need to determine the balance between power consumption and the performance of the system. For example, in the average office scenario, it might not be worth purchasing a noisy and power-hungry PC just because it ends up with a 2000 score in the SYSmark 25 benchmarks. In order to provide a balanced perspective, SYSmark 25 also allows vendors and decision makers to track the energy consumption during each workload. In the graphs below, we find the total energy consumed by the PC under test for a single iteration of each SYSmark 25 workload. For reference, the calibration system consumes 8.88 Wh for productivity, 10.81 Wh for creativity, and 19.69 Wh overall.
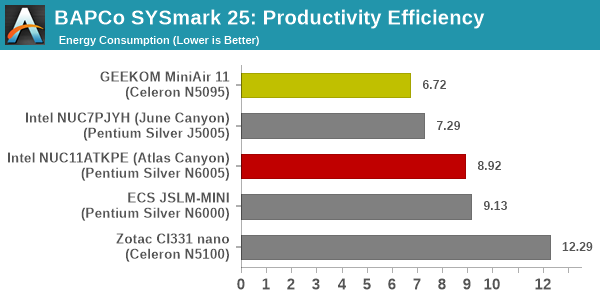
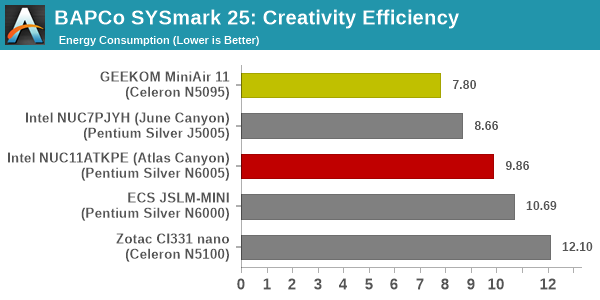
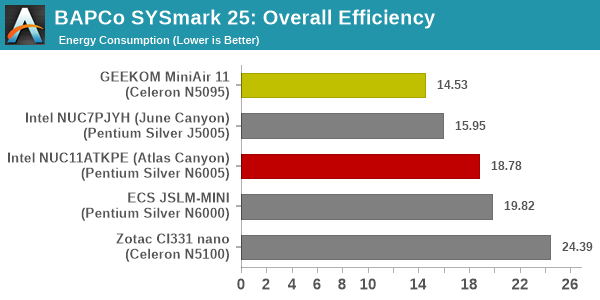
Almost all the observations made for the PCMark 10 benchmarks hold true here too. The Atlas Canyon NUC is on top, and the ZBOX CI331 nano manages to sneak in ahead of the MiniAir 11 despite being passively cooled. The MiniAir 11 pays the penalty for prioritizing cooling requirements / silence (by lowering PL1 and PL2), and cost (by configuring the system with single-channel memory). However, the same aspects help the system in delivering very good energy efficiency - yes, it does perform slower in the benchmarks, but it makes up for it by consuming very less power for the workload duration. The comparison for the June Canyon and Atlas Canyon on the energy front is more interesting. The Atlas Canyon NUC delivers approximately 60% better performance at the cost of 18% additional energy.
BAPCo CrossMark 1.0.1.86
BAPCo's CrossMark aims to simplify benchmark processing while still delivering scores that roughly tally with SYSmark. The main advantage is the cross-platform nature of the tool - allowing it to be run on smartphones and tablets as well.
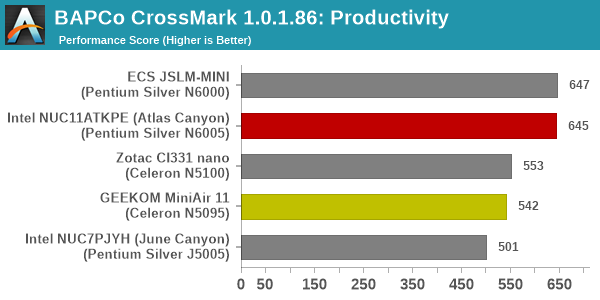
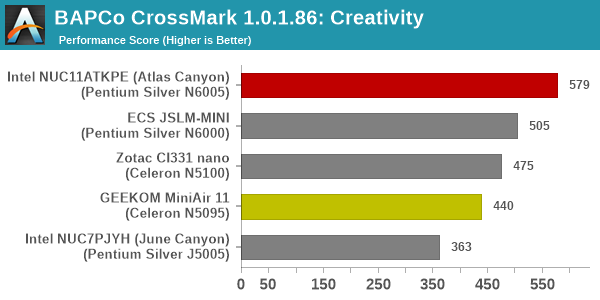
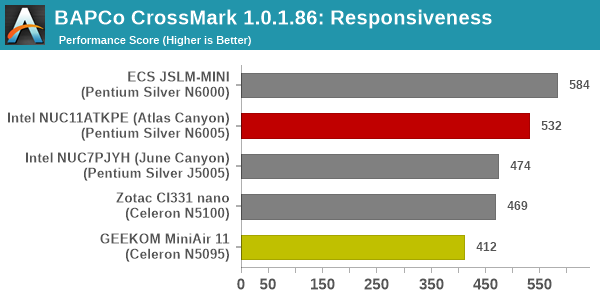
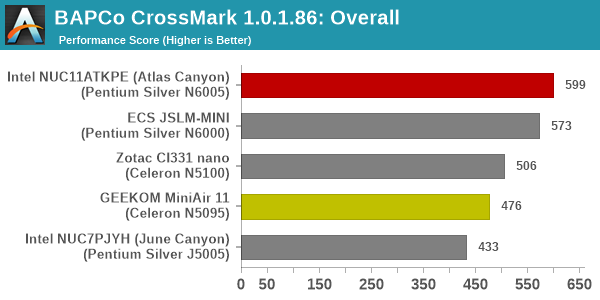
The relative performance seen in SYSmark 25 translate to CrossMark also, as expected. The responsiveness ratings vary significantly due to the usage of SATA SSDs in the MiniAir 11 and the ZBOX CI331 nano, compared to NVMe ones in others.


21 Comments
View All Comments
flgt - Thursday, July 14, 2022 - link
Nice article. I don’t like how so much performance is driven by relatively hidden PL1/PL2 settings. Have regular NUC12’s been released yet?AdrianBc - Friday, July 15, 2022 - link
Intel has developed a "Wall Street Canyon" NUC with Alder Lake P, as a replacement for the NUC 11 Pro with Tiger Lake, and which has about the same interfaces but with a much faster CPU.Photos of working prototypes have been leaked, but the launch of the product has been delayed for unknown causes, maybe component shortages. Nevertheless, I do not believed that it will be canceled, but maybe it will be launched later this year.
A very similar NUC-like barebone is already available from ASRock Industrial, as "NUC BOX-12xxP", e.g. "NUC BOX-1260xP", which, compared to Intel, has dual 2.5G Ethernet instead of single 2.5G Ethernet, and 3 DisplayPort (2 on TB) + 1 HDMI instead of 2 DisplayPort (both on TB) + 2 HDMI.
AdrianBc - Friday, July 15, 2022 - link
Sorry, I have pressed "Submit" without rereading and there are a couple of typos.The names for the ASRockInd alternatives are "NUC BOX-1260P", "NUC BOX-1240P", etc.
mode_13h - Friday, July 15, 2022 - link
OMG. I thought "Wall Street Canyon" NUC was a joke. Still funny, though.Sivar - Thursday, July 14, 2022 - link
Some means to compare these values vs. a full desktop CPU would be helpful. In isolation, I can see that the Pentium Silver N6005 is much faster than the J5005, but I have no idea if it is 90% the performance of a desktop CPU, or 60%, or 4%, etc.Perhaps a link to a reasonably comparable desktop CPU review.
mode_13h - Friday, July 15, 2022 - link
> Some means to compare these values vs. a full desktop CPU would be helpful.100% agree. We do have a few data points, however. Using data from https://www.anandtech.com/show/17231/the-intel-cor... we can see:
CineBench R23: Single-threaded
-----------------
NUC11ATKPE: 716
Ryzen 3 5300G: 1338
Ryzen 5 5600G: 1434
i3-12300: 1705
CineBench R23: Mulitthreaded
-----------------
NUC11ATKPE: 2521
Ryzen 3 5300G: 6770
Ryzen 5 5600G: 10601
i3-12300: 8598
Obviously, software rendering is not the kind of workload Tremont is optimized for.
Next, there's Handbrake, but the i3-12300 article used version 1.3.2 and this uses 1.5.1. Without at least a benchmark of the same hardware on both versions, we can't know how much variation is introduced by the new software version.
7-zip might have a similar version difference (earlier article references "1900", while this one uses 21.7), and it's not clear if the test cases are even the same.
And that's basically all the overlap I found. That's less than I thought or hoped for. It's disappointing how much the software versions and format of the results changed, such that I can't even tell whether a given test is using the same workload between the articles.
Hresna - Tuesday, July 19, 2022 - link
Funny, I was just thinking this yesterday. It’s widely impractical I know but perhaps a single chart showing the numbers in context of “modern desktop computing” would add to the general consumption-ability for us casual readers.For so many reviews I end up side-channel trying to look up/remember “ok, what’s my firestrike number again?”.
t.s - Thursday, July 14, 2022 - link
"a 2022 consumer-focused NUC without a single Type-C port is strange to see" LOL. Hello. This is Intel we're talking about, bro.abufrejoval - Thursday, July 14, 2022 - link
Well, you certainly did a much better job than I did with my Atlas Canyon NUC and caught me with quite a few mistakes, too. E.g. I had mis-identified the front panel header hidden under the rubber cap as a USB2 port.I also hadn’t really noticed that PL1/2 had gone to 15/25 in the max performance settings, I guess I was still relying far too much on my Gemini Lake observations.
I’ve never actually observed 25 Watts with HWinfo, the iGPU never goes beyond 5 Watts and the CPU will stay shy of 15 resulting in a 20 Watt total.
For the NUC’s WIFI the most important aspect is that it’s socketed, unlike e.g. on the Tiger Lake NUC11. I had bought a bunch of AX200 cards some time back, because at just €20 they were twice the price of shipping and I replaced the WIFI before I even booted the system.
I got a whole box of below-acceptable WIFI cards, that’s just electronic waste from the factory, because quite a few high-range notebooks also come with such crippling kit.
Likewise, I have another box of RealTek based USB3 2.5 Gbit/s Ethernet adapters, to bring a bit of balance to these systems, which I tend to use with GlusterFS.
I also didn’t have DDR4-2933 SO-DIMMs lying around and was ever so glad the 2x 32GB DDR4-3200 I borrowed from my Tiger Lake NUC11 worked, even if they took quite a bit of time at the initial boot to be configured properly.
DDR4-2400 SO-DIMMS will work just as well and honestly there is very little real difference in performance. The memory bandwidth on Geekbench 4 will change from 16.9/GBs to 17.3GB/s for single core and from 22.2GB/s to 25.6GB/s on multi core. The same DDR4-3200 SO-DIMMs deliver 35.6GB/s single core memory bandwidth with the Tiger Lake’s i7-1165G7 and 39.7GB/s on the multi-core variant, which would almost seem to indicate, that the latest Atom continues to be a single-channel design, like the J5005, N3700 and J1900 predecessors, where the 2nd module never delivered more than a 10% bandwidth increase.
Jasper lake drops to 12.8GB/s with a single module on both the single and the multi core variants of the Geekbench 4 memory bandwidth benchmark and I’m sure the impact on the iGPU would be rather significant, even if I didn’t measure to confirm.
Next I dropped PL1/PL2 to 10/12 Watts (the BIOS won’t allow 10/10) and TAU to 1 second, just to see differentiate properly between the generational improvements of Jasper Lake vs. Goldmont Plus and the additional TDP budget: it barely made a difference on Geekbench 5, whilst HWinfo did confirm that the lower TDP limits were indeed observed.
It takes Prime95 to confirm, that the TDP budget difference has an impact on the clocks, Geekbench is just too light a workload. And in combination with Furmark, you can also nicely observe that the iGPU TDP share is fixed at 5 Watts, while the CPU core have to manage with what’s left at 25 or 15 Watts after TAU.
I do believe the Atlas Canyon NUC11 is a rather good deal for the €200 price, if you can get one. I’ve found a niche dealer here in Germany (minipc.de), that still has dozens in stock but that seems a rare exception. There are still some N6005 based firewall appliances available from China, even fully passive but at closer to €500 before taxes.
Ian started to ruminate on how he’d be able to measure the generational improvements of Grace Mont over Jasper Lake by using Lasso to control CPU core assignments on an Alder Lake base. Too bad he then never got around testing that, because it could have helped to gauge a hypothetical all-E-core chip.
Jasper Lake does rather well against say a Broadwell based Xeon D-1541 at 2.7GHz so it’s easy to see why they are not to keen on seeing these low-end devices compete in the mini-server market. Elkhart Lake Atoms variants which support inline ECC would certainly create an issue, if they sold for a similar price than Jasper Lake (I heavily suspect they are the same silicon). But a SuperMicro mainboard with zero other distinguishing features (e.g. only Gbit Ethernet) is listed at €800, way beyond what I’d want to pay for ECC alone.
mode_13h - Friday, July 15, 2022 - link
> DDR4-2400 SO-DIMMS will work just as well and honestly there is very little real difference in> performance. The memory bandwidth on Geekbench 4 will change from 16.9/GBs to 17.3GB/s
> for single core and from 22.2GB/s to 25.6GB/s on multi core.
> ... the latest Atom continues to be a single-channel design
> Jasper lake drops to 12.8GB/s with a single module on both the single and the multi core
That's a 35% benefit for single-core and a 100% boost for multi-core. Whatever is going on there, I think it's simplistic to say the SoC is simply designed for single-channel.
It's weird that they hampered it, because they're just leaving performance on the table. I wonder if maybe the memory controller is more optimized for LPDDR4 and the regular DDR4 performance is more of an afterthought.
BTW, thanks for your TDP testing, also.