Apple's M1 Pro, M1 Max SoCs Investigated: New Performance and Efficiency Heights
by Andrei Frumusanu on October 25, 2021 9:00 AM EST- Posted in
- Laptops
- Apple
- MacBook
- Apple M1 Pro
- Apple M1 Max
CPU MT Performance: A Real Monster
What’s more interesting than ST performance, is MT performance. With 8 performance cores and 2 efficiency cores, this is now the largest iteration of Apple Silicon we’ve seen.
As a prelude into the scores, I wanted to remark some things on the previous smaller M1 chip. The 4+4 setup on the M1 actually resulted that a significant chunk of the MT performance being enabled by the E-cores, with the SPECint score in particular seeing a +33% performance boost versus just the 4 P-cores of the system. Because the new M1 Pro and Max have 2 less E-cores, just assuming linear scaling, the theoretical peak of the M1 Pro/Max should be +62% over the M1. Of course, the new chips should behave better than linear, due to the better memory subsystem.
In the detailed scores I’m showcasing the full 8+2 scores of the new chips, and later we’ll talk about the 8 P scores in context. I hadn’t run the MT scores of the new Fortran compiler set on the M1 and some numbers will be missing from the charts because of that reason.
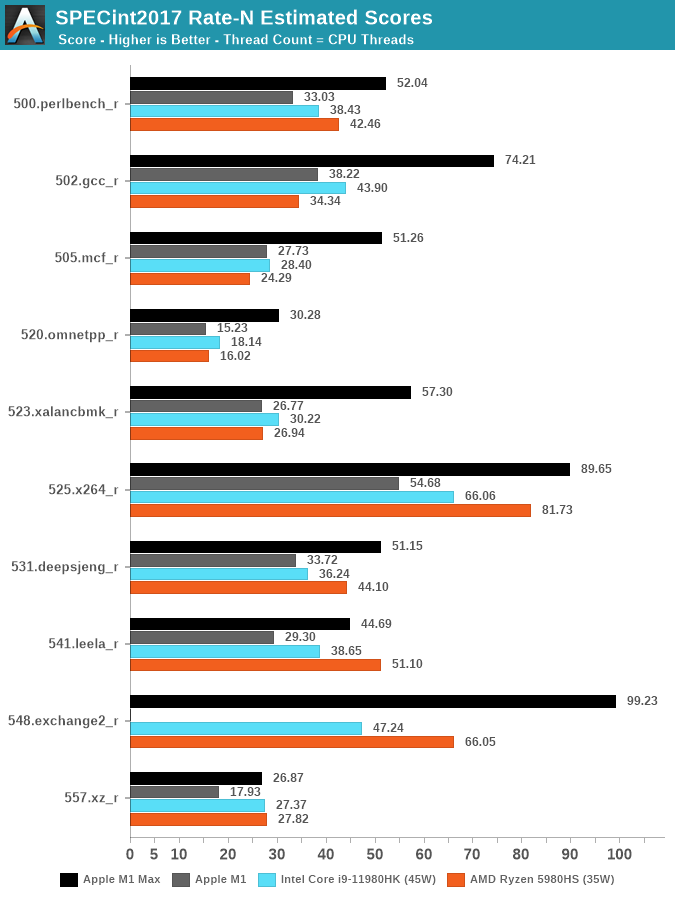
Looking at the data – there’s very evident changes to Apple’s performance positioning with the new 10-core CPU. Although, yes, Apple does have 2 additional cores versus the 8-core 11980HK or the 5980HS, the performance advantages of Apple’s silicon is far ahead of either competitor in most workloads. Again, to reiterate, we’re comparing the M1 Max against Intel’s best of the best, and also nearly AMD’s best (The 5980HX has a 45W TDP).
The one workload standing out to me the most was 502.gcc_r, where the M1 Max nearly doubles the M1 score, and lands in +69% ahead of the 11980HK. We’re seeing similar mind-boggling performance deltas in other workloads, memory bound tests such as mcf and omnetpp are evidently in Apple’s forte. A few of the workloads, mostly more core-bound or L2 resident, have less advantages, or sometimes even fall behind AMD’s CPUs.
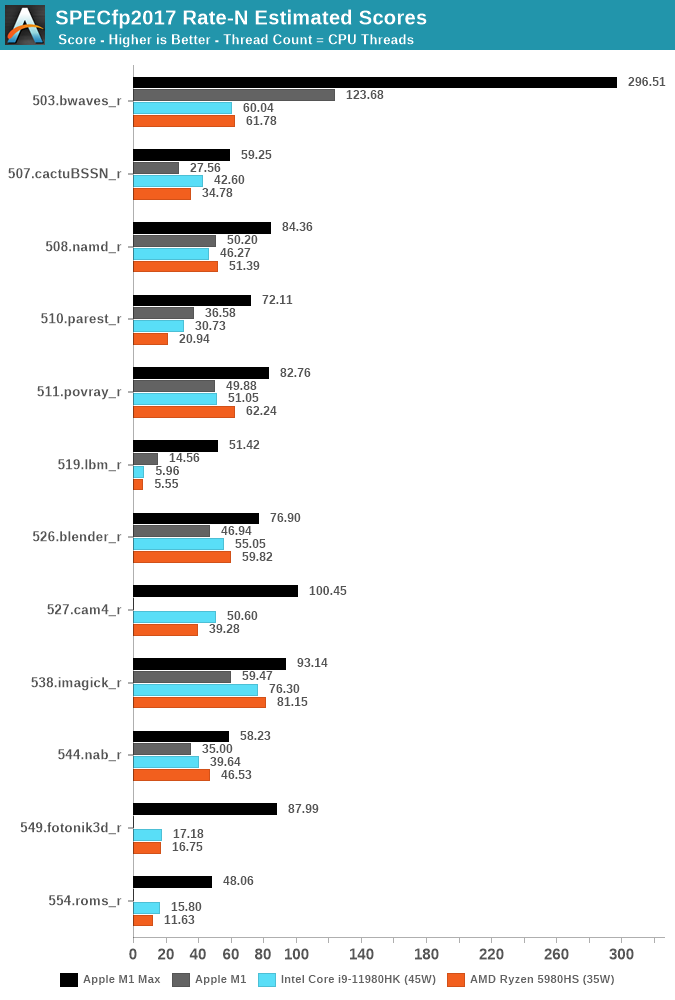
The fp2017 suite has more workloads that are more memory-bound, and it’s here where the M1 Max is absolutely absurd. The workloads that put the most memory pressure and stress the DRAM the most, such as 503.bwaves, 519.lbm, 549.fotonik3d and 554.roms, have all multiple factors of performance advantages compared to the best Intel and AMD have to offer.
The performance differences here are just insane, and really showcase just how far ahead Apple’s memory subsystem is in its ability to allow the CPUs to scale to such degree in memory-bound workloads.
Even workloads which are more execution bound, such as 511.porvray or 538.imagick, are – albeit not as dramatically, still very much clearly in favour of the M1 Max, achieving significantly better performance at drastically lower power.
We noted how the M1 Max CPUs are not able to fully take advantage of the DRAM bandwidth of the chip, and as of writing we didn’t measure the M1 Pro, but imagine that design not to score much lower than the M1 Max here. We can’t help but ask ourselves how much better the CPUs would score if the cluster and fabric would allow them to fully utilise the memory.
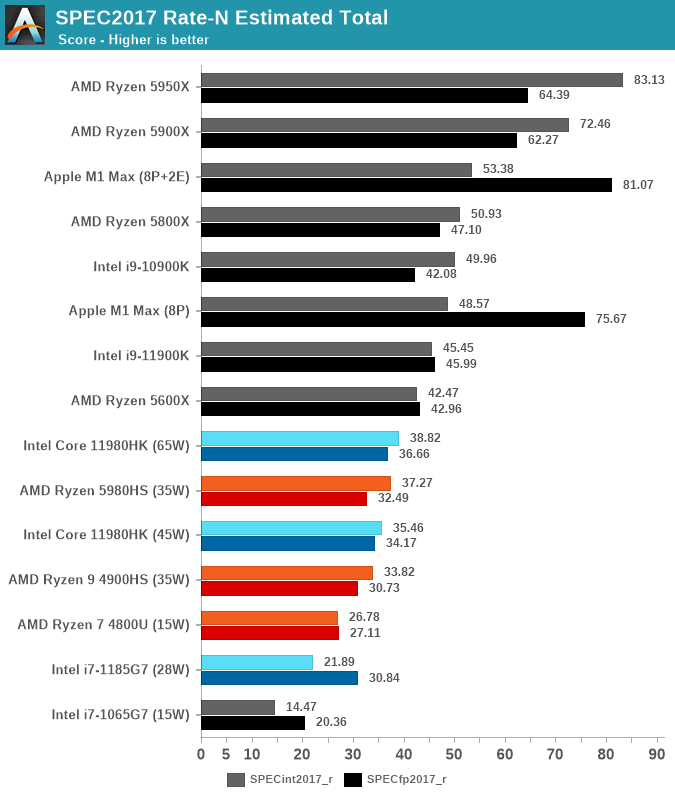
In the aggregate scores – there’s two sides. On the SPECint work suite, the M1 Max lies +37% ahead of the best competition, it’s a very clear win here and given the power levels and TDPs, the performance per watt advantages is clear. The M1 Max is also able to outperform desktop chips such as the 11900K, or AMD’s 5800X.
In the SPECfp suite, the M1 Max is in its own category of silicon with no comparison in the market. It completely demolishes any laptop contender, showcasing 2.2x performance of the second-best laptop chip. The M1 Max even manages to outperform the 16-core 5950X – a chip whose package power is at 142W, with rest of system even quite above that. It’s an absolutely absurd comparison and a situation we haven’t seen the likes of.
We also ran the chip with just the 8 performance cores active, as expected, the scores are a little lower at -7-9%, the 2 E-cores here represent a much smaller percentage of the total MT performance than on the M1.
Apple’s stark advantage in specific workloads here do make us ask the question how this translates into application and use-cases. We’ve never seen such a design before, so it’s not exactly clear where things would land, but I think Apple has been rather clear that their focus with these designs is catering to the content creation crowd, the power users who use the large productivity applications, be it in video editing, audio mastering, or code compiling. These are all areas where the microarchitectural characteristics of the M1 Pro/Max would shine and are likely vastly outperform any other system out there.


493 Comments
View All Comments
techconc - Monday, October 25, 2021 - link
I guess you missed the section where they showed the massive performance gains for the various content creation applications.GatesDA - Monday, October 25, 2021 - link
Apple currently has the benefit of an advanced manufacturing process. If it feels like future tech compared to Intel/AMD, that's because it is. The real test will be if it still holds up when x86 chips are on equal footing.Notably, going from M1 Pro to Max adds more transistors than the 3080 has TOTAL. This wouldn't be feasible without the transistor density of TSMC's N5 process. M1's massive performance CPU cores also benefit from the extra transistor density.
Samsung and Intel getting serious about fabrication mean it'll be much harder for future Apple chips to maintain a process advantage. From the current roadmaps they'll actually fall behind, at least for a while.
michael2k - Monday, October 25, 2021 - link
That's a tautology and therefore a fallacy and bad logic:Apple is only ahead because they're ahead. When they fall behind they will fall behind.
You can deconstruct your fallacy by asking this:
When will Intel get ahead of Apple? The answer is never, at least according to Intel itself:
https://appleinsider.com/articles/21/03/23/now-int...
By the time Intel has surpassed TSMC, it means Intel will need to have many more customers to absorb the costs of surpassing TSMC, because it means Intel's process advantage will be too expensive to maintain without the customer base of TSMC.
kwohlt - Tuesday, October 26, 2021 - link
It's pretty clear that Apple will never go back to x86/64, and that they will be using in-house designed custom silicon for their Macs. Doesn't matter how good AMD or Intel get, Apple's roadmap on that front is set in stone for as far into the future as corporate roadmaps are made.Intel saying they hope to one day get A and M series manufacturing contracts suggests they're confident about their ability to rival TSMC in a few years, not that they will never be able to reach Apple Silicon perf/watt.
Intel def won't come close to M series in perf/watt until at least 2025 with Royal Core Project, and even then, who knows, still probably not.
daveinpublic - Monday, October 25, 2021 - link
So by your logic, Apple is ahead right now.Samsung and Intel are behind right now. And could be for a while.
Sunrise089 - Tuesday, October 26, 2021 - link
The Apple chips have perf/watt numbers in some instances 400% better than the Intel competition. Just how much benefit are you expecting a node shrink to provide? Are you seriously suggesting Intel would see a doubling, tripling, or even quadrupling of perf/watt via moving to a smaller node? You are aware node shrink efficiency gains don’t remotely approach that level of improvement be it on Intel or TSMC, aren’t you?“Samsung and Intel getting serious about fabrication.” What does this even mean? Intel has been the world leader in fabrication investment and technology for decades before recently falling behind. How on earth could you possibly consider them not ‘serious’ about it?
AshlayW - Tuesday, October 26, 2021 - link
Firestorm cores have >2X the transistors as Zen3/Sunny Cove cores in >2X the area on the same process (or slightly less). The cores are designed to be significantly wider making use of the N5 process, and yes, I very much expect at LEAST a doubling of perf/w from N5 CPUs from AMD, since they doubled Ryzen 2000 with 3000, and +25% from 3000 to 5000 on the same N7 node.kwohlt - Tuesday, October 26, 2021 - link
Ryzen 3000 doubled perf/watt over Ryzen 2000?? Which workloads on which SKUs are you comparing?dada_dave - Monday, October 25, 2021 - link
So I wonder why Geekbench scores have so far shown M1Max very far off it's expected score relative to the M1 (22K)? I've checked other GPUs in its score range across a variety of APIs (including Metal) and so far they all show the expected scaling (or close enough) between TFLOP and GB score except the M1 Max. Even the 24 core Max is not that far off, it's the 32 core scores are really far off. They should be in the 70Ks or even high 80Ks for perfect scaling which is achieved by the 16-core Pro GPU, but the 32-core scores are actually in the upper 50Ks/low 60Ks. Do you have any hypotheses as to why that is? Also does the 16" have the high performance mode supposedly coming (or here already)?Andrei Frumusanu - Monday, October 25, 2021 - link
The GB compute is too short in bursts and the GPU isn't ramping up to peak frequencies. Just ignore it.