Intel Beast Canyon NUC Review: Desktop Tiger Lake Debuts in SFF Gaming Powerhouse
by Ganesh T S on July 29, 2021 9:00 AM EST- Posted in
- Systems
- Intel
- NUC
- Tiger Lake
- NUC11
- Beast Canyon
UL Benchmarks - PCMark and 3DMark
This section deals with a couple of UL Futuremark benchmarks - PCMark 10 and 3DMark. While PCMark evaluates the system as a whole, 3DMark focuses on the graphics capabilities with emphasis on gaming workloads.
PCMark 10
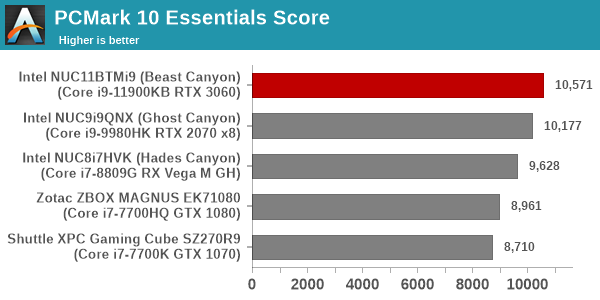
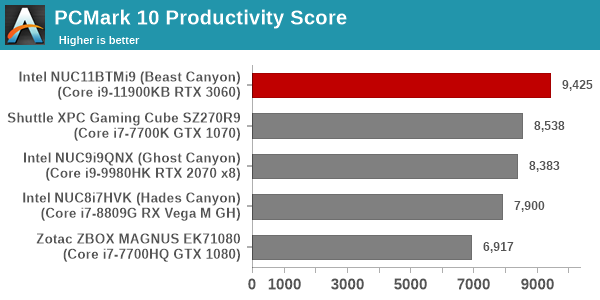
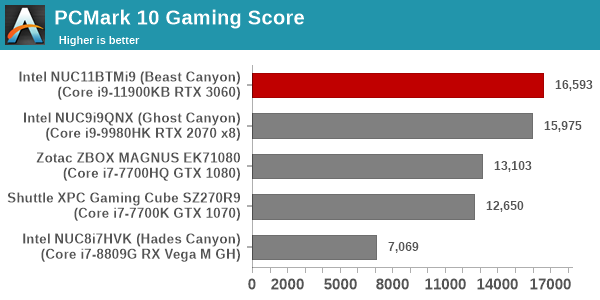
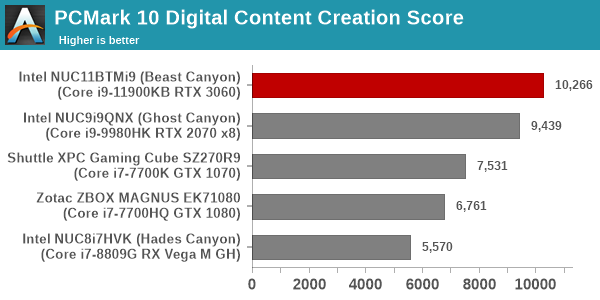
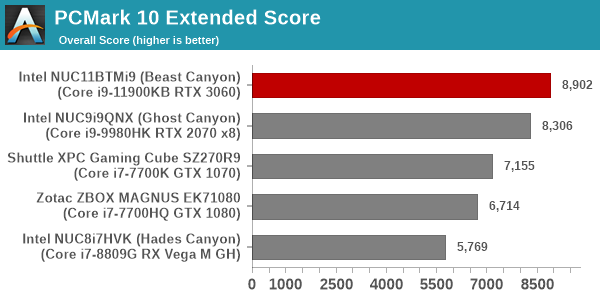
UL's PCMark 10 evaluates computing systems for various usage scenarios (generic / essential tasks such as web browsing and starting up applications, productivity tasks such as editing spreadsheets and documents, gaming, and digital content creation). We benchmarked select PCs with the PCMark 10 Extended profile and recorded the scores for various scenarios. These scores are heavily influenced by the CPU and GPU in the system, though the RAM and storage device also play a part. The power plan was set to Balanced for all the PCs while processing the PCMark 10 benchmark.
3DMark
UL's 3DMark comes with a diverse set of graphics workloads that target different Direct3D feature levels. Correspondingly, the rendering resolutions are also different. We use 3DMark 2.4.4264 to get an idea of the graphics capabilities of the system. In this section, we take a look at the performance of the Intel NUC11BTMi9 (Beast Canyon) across the different 3DMark workloads.
3DMark Ice Storm
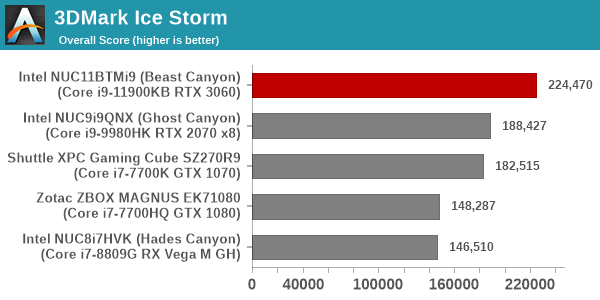
This workload has three levels of varying complexity - the vanilla Ice Storm, Ice Storm Unlimited, and Ice Storm Extreme. It is a cross-platform benchmark (which means that the scores can be compared across different tablets and smartphones as well). All three use DirectX 11 (feature level 9) / OpenGL ES 2.0. While the Extreme renders at 1920 x 1080, the other two render at 1280 x 720. The graphs below present the various Ice Storm worloads' numbers for different systems that we have evaluated.
| UL 3DMark - Ice Storm Workloads | |||
3DMark Cloud Gate
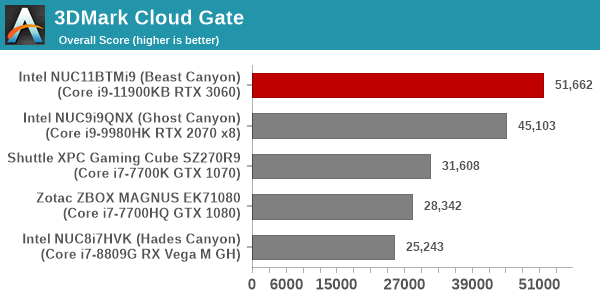
The Cloud Gate workload is meant for notebooks and typical home PCs, and uses DirectX 11 (feature level 10) to render frames at 1280 x 720. The graph below presents the overall score for the workload across all the systems that are being compared.
3DMark Fire Strike
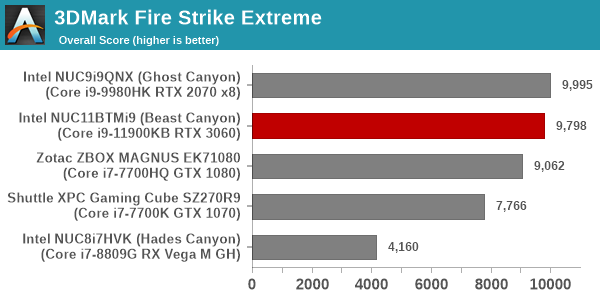
The Fire Strike benchmark has three workloads. The base version is meant for high-performance gaming PCs. Similar to Sky Diver, it uses DirectX 11 (feature level 11) to render frames at 1920 x 1080. The Extreme version targets 1440p gaming requirements, while the Ultra version targets 4K gaming system, and renders at 3840 x 2160. The graph below presents the overall score for the Fire Strike Extreme and Fire Strike Ultra benchmark across all the systems that are being compared.
| UL 3DMark - Fire Strike Workloads | |||
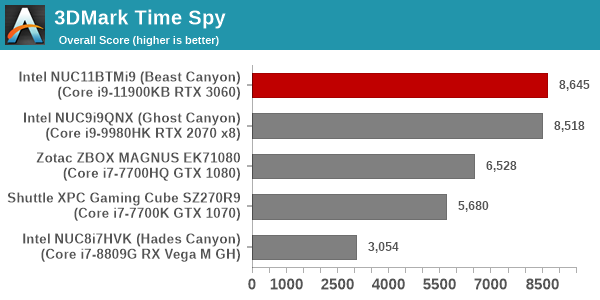
3DMark Time Spy
The Time Spy workload has two levels with different complexities. Both use DirectX 12 (feature level 11). However, the plain version targets high-performance gaming PCs with a 2560 x 1440 render resolution, while the Extreme version renders at 3840 x 2160 resolution. The graphs below present both numbers for all the systems that are being compared in this review.
| UL 3DMark - Time Spy Workloads | |||
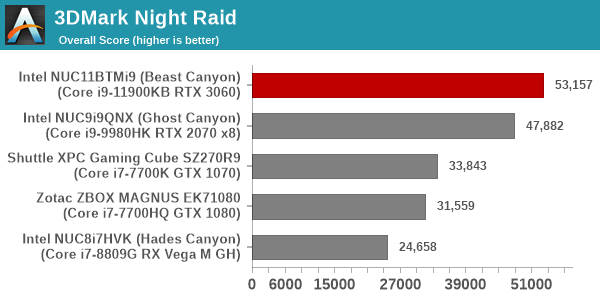
3DMark Night Raid
The Night Raid workload is a DirectX 12 benchmark test. It is less demanding than Time Spy, and is optimized for integrated graphics. The graph below presents the overall score in this workload for different system configurations.
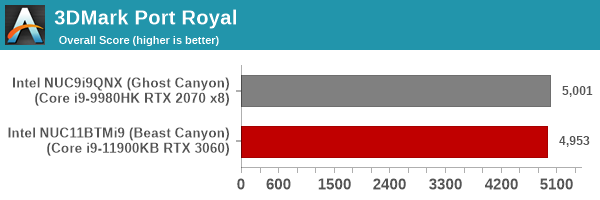
3DMark Port Royal
UL introduced the Port Royal ray-tracing benchmark as a DLC for 3DMark in early 2019. The scores serve as an indicator of how the system handles ray-tracing effects in real-time.
3DMark CPU Profile Benchmark
UL recently introduced a benchmark to test the multi-threaded capabilities of the CPU in a system. Since gaming workloads are often multi-threaded, it makes sense to include this testing as part of the 3DMark suite. The benchmark routine attempts to perform the simulation of birds / bird-like objects flocking together using as many advanced capabilities as offered by the processor. The workload is configured to run with different number of threads ranging from 1 to 16 (and a single entry for the maximum number of threads allowed in the system).
| UL 3DMark - CPU Profile Benchmark | |||
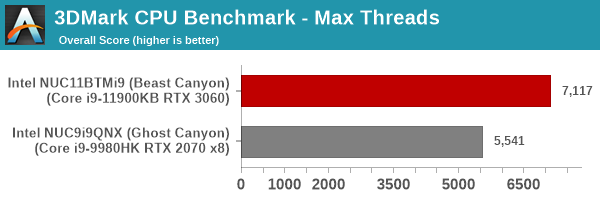
We present the benchmark results for the single and maximum threads case above.
In almost all workloads, the Beast Canyon outscores other systems heavily. In the case of GPU-bound workloads, the tussle between the RTX 2070 in the Ghost Canyon and the RTX 3060 in the Beast Canyon is too close to call.


84 Comments
View All Comments
sorten - Thursday, July 29, 2021 - link
"It's really a shame that AMD doesn't have something like this"They do. Pick one of the dozens of SFF cases on the market and build (or buy) it yourself. The only thing you'll be missing is the soldered CPU preventing an easy upgrade.
n0x1ous - Thursday, July 29, 2021 - link
would have been nice to see the Razer Tomahawk Ghost Canyon NUC compared to thisrepoman27 - Thursday, July 29, 2021 - link
A couple minor nits..."The slot to the right of the processor is enabled by the x4 Gen 4 lanes directly from the processor, while the two to the right (and the M.2 slot occupied by the WLAN card) are from the PCH."
One of those rights is wrong.
"They can operate in Thunderbolt 4 (40Gbps), native USB 4 (10Gbps), and native DP1.4 modes."
That should be: "They can operate in Thunderbolt 4 / USB4 (40 Gbps), native USB3 (10 Gbps), and native DisplayPort 1.4 (8.1 Gbps, DSC 1.1 supported) modes."
repoman27 - Thursday, July 29, 2021 - link
Dang it, DP is 4 lanes so my correction requires correction.That should be: "They can operate in Thunderbolt 4 / USB4 (40 Gbps), native USB3 (10 Gbps), and native DisplayPort 1.4 (32.4 Gbps, DSC 1.1 supported) modes."
mcnabney - Thursday, July 29, 2021 - link
Would have liked to see the metrics also include a regular non-SFF build which included similar parts (CPU/GPU/RAM/NVME) to contrast what is being given up for the size shrink.Calin - Friday, July 30, 2021 - link
Just to see how much a power dissipation of 200W instead of 100W would help a 65W processor.mode_13h - Monday, August 2, 2021 - link
Yeah, a Rocket Lake i9 would've been an interesting comparison. I think TomsHardware tried that, if you want to look it up.Timoo - Thursday, July 29, 2021 - link
Wasn't Intel that company that locked-in their vendors, to make sure that suprerior competitors didn't get a chance?For which they had to pay petty-handouts in lawsuits (like: singular billions), because the real/justicial world wasn't used to the profits made by their criminal behaviour?
5j3rul3 - Thursday, July 29, 2021 - link
Like to see the comprasion between the NUC11i9 with R7 5800X, i9 11900K, i9 10900K, 5800U, 5980HS, 1165G7, 11980HK and Apple M1.8 Cores the Great🤣
I am also curious about the Perf. of Xe Graphic in the i9 10900KB
But it seems the i9 10900KB is the
better i9 for intel DT user.
hubick - Thursday, July 29, 2021 - link
I've owned two Skull Canyon NUC's, two Hades Canyon, and a Ghost Canyon NUC 9 Pro. I love the expandability of the card slot in the Ghost Canyon NUC 9 Pro, but I think Beast Canyon has crossed a line where it's just too large for me now. You could still take a Ghost Canyon as carry-on on a flight no problem, or shove it in a backpack for a bike commute - but this just is just so chunky and boxy, it looks too much like something that belongs on a desk.Can I buy the new compute element card and put it in a Ghost Canyon case?
Will there be an updated Xeon compute element? I'm running mine as a NAS box with a ZFS drive array connected via Thunderbolt, and ZFS wants the ECC RAM.