The Inland Performance Plus 2TB SSD Review: Phison's E18 NVMe Controller Tested
by Billy Tallis on May 13, 2021 8:00 AM ESTMixed IO Performance
For details on our mixed IO tests, please see the overview of our 2021 Consumer SSD Benchmark Suite.
 |
|||||||||
| Mixed Random IO | Throughput | Power | Efficiency | ||||||
| Mixed Sequential IO | Throughput | Power | Efficiency | ||||||
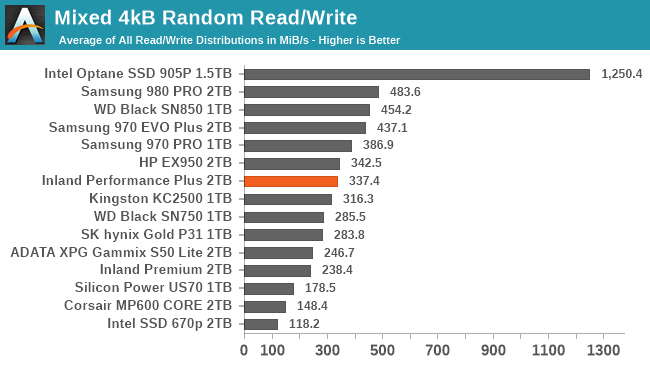
The Inland Performance Plus with the Phison E18 controller sets a new record for performance on our mixed sequential IO test, and it provides pretty good power efficiency on that test. It has somewhat disappointing performance on the mixed random IO test, with a few Gen3 TLC drives delivering better performance, and most of the 8-channel TLC drives delivering better efficiency.
 |
|||||||||
| Mixed Random IO | |||||||||
| Mixed Sequential IO | |||||||||
On the sequential IO test, the Inland Performance Plus is a bit slow to start when the workload is very read-heavy, but quickly ramps up to about 6GB/s. Like many drives, performance is low to begin with as these drives aren't exactly optimized for juggling several parallel streams of sequential reads. Once the workload has shifted to include a significant amount of writes, caching makes things easier for the drives to manage and performance tends to improve. The E18 controller makes that transition early and with as big a performance gain as any drive, and things hold relatively steady around 6GB/s through the rest of the test.
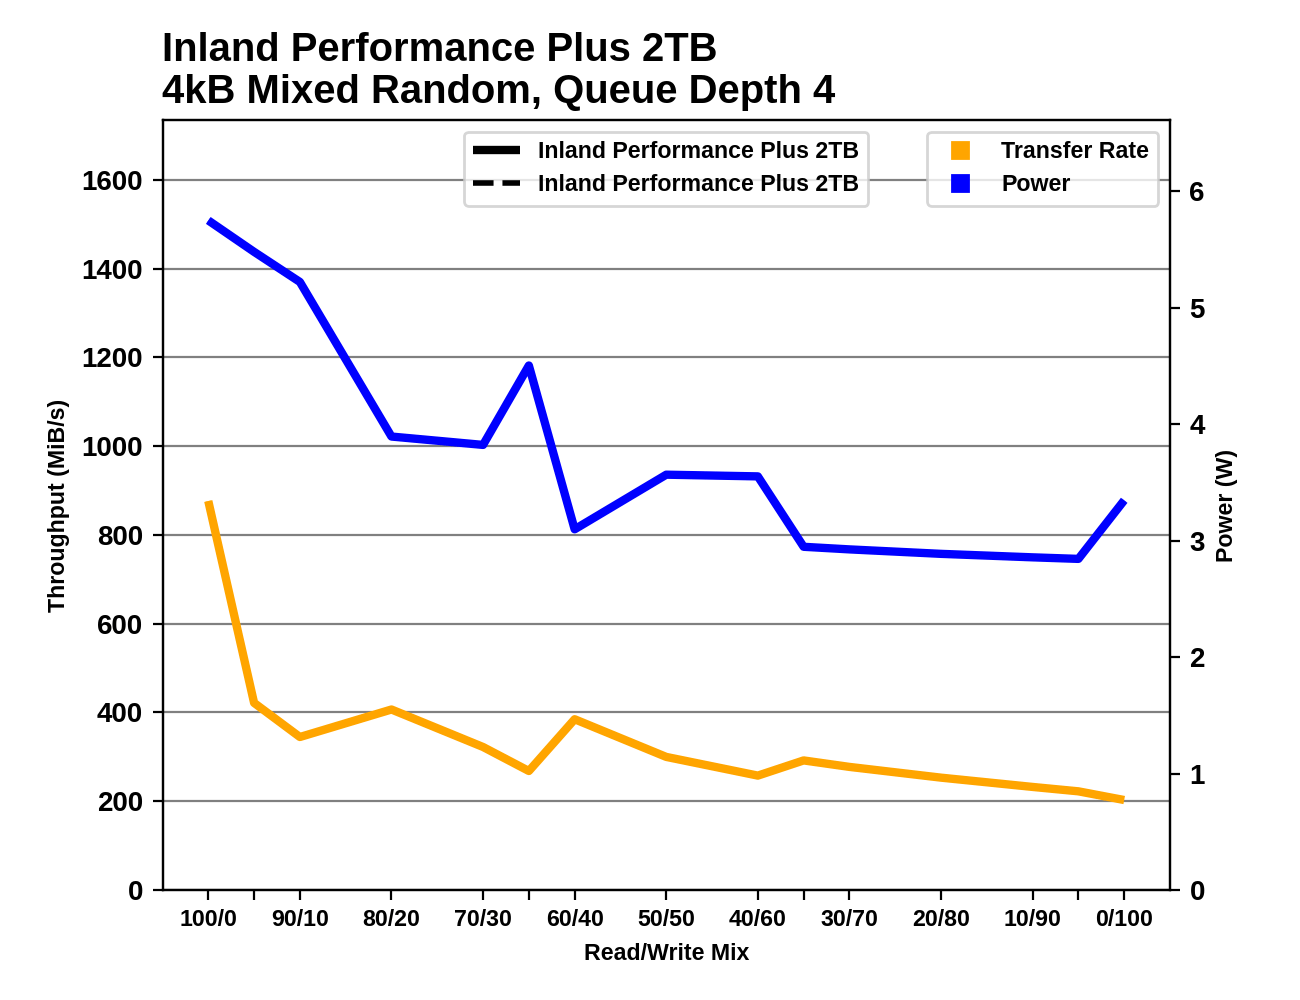
On the random IO test, the Performance Plus is less consistent. After the typical initial performance drop that comes from adding the first bit of writes to the mix, the Performance Plus generally keeps slowing down but there's quite a bit of variability. The higher power consumption during phases where performance is lower indicates that there's background work to clean up the SLC cache interfering with benchmark performance. Things settle down during the last third of the test.
Power Management Features
Real-world client storage workloads leave SSDs idle most of the time, so the active power measurements presented earlier in this review only account for a small part of what determines a drive's suitability for battery-powered use. Especially under light use, the power efficiency of a SSD is determined mostly be how well it can save power when idle.
For many NVMe SSDs, the closely related matter of thermal management can also be important. M.2 SSDs can concentrate a lot of power in a very small space. They may also be used in locations with high ambient temperatures and poor cooling, such as tucked under a GPU on a desktop motherboard, or in a poorly-ventilated notebook.
| Inland Performance Plus 2TB NVMe Power and Thermal Management Features |
|||
| Controller | Phison E18 | ||
| Firmware | EIFM21.1 | ||
| NVMe Version |
Feature | Status | |
| 1.0 | Number of operational (active) power states | 3 | |
| 1.1 | Number of non-operational (idle) power states | 2 | |
| Autonomous Power State Transition (APST) | Supported | ||
| 1.2 | Warning Temperature | 70 °C | |
| Critical Temperature | 110 °C | ||
| 1.3 | Host Controlled Thermal Management | Supported | |
| Non-Operational Power State Permissive Mode | Supported | ||
The Phison E18 as used in the Inland Performance Plus supports the full range of NVMe power and thermal management features, but with the somewhat implausible 110 °C critical temperature threshold. The deepest idle power state also claims only a 30% reduction in power at the cost of much higher entry and exit latencies. Fortunately, as shown below the lowest idle power state saves a lot more power than indicated by this firmware information.
| Inland Performance Plus 2TB NVMe Power States |
|||||
| Controller | Phison E18 | ||||
| Firmware | EIFM21.1 | ||||
| Power State |
Maximum Power |
Active/Idle | Entry Latency |
Exit Latency |
|
| PS 0 | 8.8 W | Active | - | - | |
| PS 1 | 7.1 W | Active | - | - | |
| PS 2 | 5.2 W | Active | - | - | |
| PS 3 | 62 mW | Idle | 2 ms | 2 ms | |
| PS 4 | 44 mW | Idle | 25 ms | 25 ms | |
Note that the above tables reflect only the information provided by the drive to the OS. The power and latency numbers are often very conservative estimates, but they are what the OS uses to determine which idle states to use and how long to wait before dropping to a deeper idle state.
Idle Power Measurement
SATA SSDs are tested with SATA link power management disabled to measure their active idle power draw, and with it enabled for the deeper idle power consumption score and the idle wake-up latency test. Our testbed, like any ordinary desktop system, cannot trigger the deepest DevSleep idle state.
Idle power management for NVMe SSDs is far more complicated than for SATA SSDs. NVMe SSDs can support several different idle power states, and through the Autonomous Power State Transition (APST) feature the operating system can set a drive's policy for when to drop down to a lower power state. There is typically a tradeoff in that lower-power states take longer to enter and wake up from, so the choice about what power states to use may differ for desktop and notebooks, and depending on which NVMe driver is in use. Additionally, there are multiple degrees of PCIe link power savings possible through Active State Power Management (APSM).
We report three idle power measurements. Active idle is representative of a typical desktop, where none of the advanced PCIe link or NVMe power saving features are enabled and the drive is immediately ready to process new commands. Our Desktop Idle number represents what can usually be expected from a desktop system that is configured to enable SATA link power management, PCIe ASPM and NVMe APST, but where the lowest PCIe L1.2 link power states are not available. The Laptop Idle number represents the maximum power savings possible with all the NVMe and PCIe power management features in use—usually the default for a battery-powered system but rarely achievable on a desktop even after changing BIOS and OS settings. Since we don't have a way to enable SATA DevSleep on any of our testbeds, SATA drives are omitted from the Laptop Idle charts.
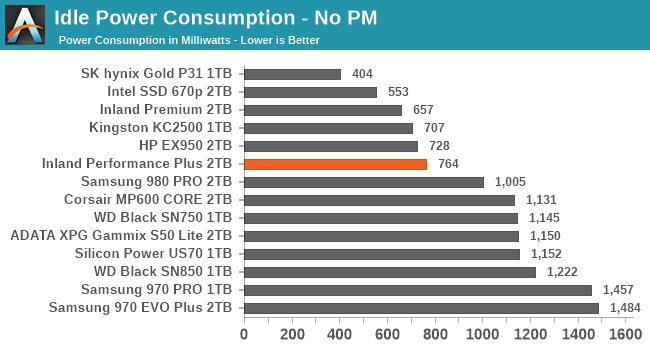
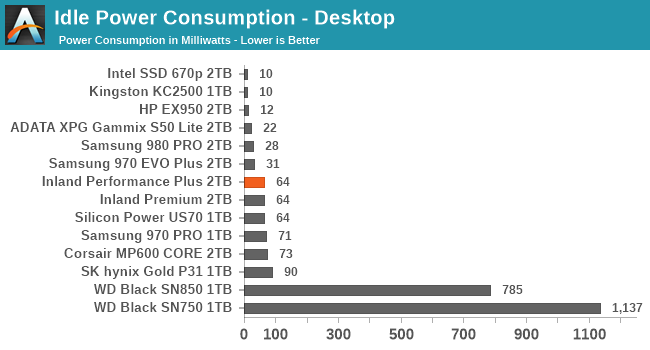
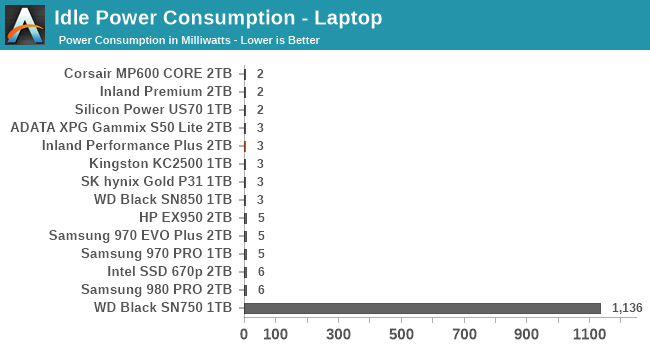
The active idle power from the E18 drive is well under 1W, a clear improvement over other Gen4 drives and many of the top-performing Gen3 drives (note: all Gen4 drives are operating at Gen3 speeds during this test, because we can't get idle power management working properly on our Gen4 testbeds; on a Gen4 system we expect active idle power to be a bit higher). The desktop idle almost exactly matches what the drive claims, and lowest laptop idle power is great at just 3mW.
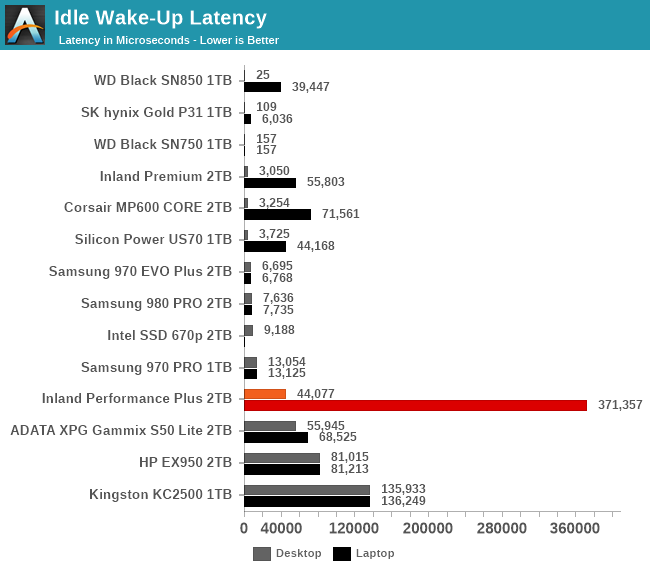
Unfortunately, wake-up times are a bit slow: wake-up from the desktop idle state is already 44ms and wake-up from the laptop idle state is a whopping 371ms, which is enough to cause noticeable delays if this power state is used frequently by the OS.


118 Comments
View All Comments
teldar - Thursday, May 13, 2021 - link
This seems ridiculous? OS queries are typically non sequential. This limits performance of everything. It's not like it's unknown that the next real step should be combined storage and ram, something that optane was supposed to do.Billy Tallis - Friday, May 14, 2021 - link
> OS queries are typically non sequential.To quantify this a bit, when I had Windows Explorer tally up the disk usage of my photos folders, about 35% of the IOs were sequential, and just over half at QD1. That should have been operating mostly on file metadata, rather than sequentially reading the actual file contents.
Valantar - Thursday, May 13, 2021 - link
Synthetic? What? The main ATSB test suite here consists of 100% real-world application traces. Sure, there are synthetics too, but the reviews are pretty explicit in pointing out that the value of those tests are mostly academic, and rather serve to illustrate why we see the differences we do in the ATSB tests.mode_13h - Thursday, May 13, 2021 - link
Please ignore the troll.Synthetics are useful for testing manufacturer claims, exploring corner cases, boundary conditions, and the outer performance envelope.
Real-world benchmarks give users some idea of what they can expect and show how the characteristics revealed in the synthetics relate to practical user experience.
Without reviews like the ones at Anandtech, manufacturers would be trying to get away with a lot more sketchy stuff, I fear, and making even more outlandish claims.
jabber - Thursday, May 13, 2021 - link
I have to say the upgrade from SSD to NVMe was one of the biggest disappointments in my computing life. There is a law of diminishing returns in day to day performance once you reach and go past 500MBps.mode_13h - Thursday, May 13, 2021 - link
Do you use antivirus? On the windows PC I use for work, they hav it so bogged down with security software that I might as well be using a hard drive!On Linux, I saw a marked difference between SATA and NVMe.
Tomatotech - Friday, May 14, 2021 - link
It depends on your OS & system. On my MacBooks, I saw a large difference going from an old but adequate 2013-era 128GB SSD to a 1TB 2019 NVMe. The new NVME was literally 3x faster in every way than the SSD and it made a huge difference to the laptop. Felt like new again.Like most things in tech, it takes around a doubling in speed for the difference to be noticeable to the user.
mode_13h - Thursday, May 13, 2021 - link
> Until Microsoft unshackles Windows from the magnetic Hard disk eraPlease explain what you mean by this. Also, not all of us are using Windows.
> I suppose these reviews and their hairsplitting synthetic benchmarks get clicks.
If you feel it's not relevant to you, then please *don't* click. And spare us your whining, as well!
I'm happy to have this review. I appreciate seeing the detailed performance analysis, as well as how much light it sheds on SSDs, their inner workings, and the overall SSD industry.
FunBunny2 - Saturday, May 15, 2021 - link
"Also, not all of us are using Windows."so far as AT Management goes, yes we are. how much ink is devoted to anything else, aka linux?
Billy Tallis - Saturday, May 15, 2021 - link
All of the synthetic tests in our SSD reviews are using Linux.