The Intel Xeon W Review: W-2195, W-2155, W-2123, W-2104 and W-2102 Tested
by Ian Cutress & Joe Shields on July 30, 2018 1:00 PM EST- Posted in
- CPUs
- Intel
- Xeon
- Workstation
- ECC
- Skylake-SP
- Skylake-X
- Xeon-W
- Xeon Scalable
Benchmarking Performance: CPU System Tests
Our first set of tests is our general system tests. These set of tests are meant to emulate more about what people usually do on a system, like opening large files or processing small stacks of data. This is a bit different to our office testing, which uses more industry standard benchmarks, and a few of the benchmarks here are relatively new and different.
All of our benchmark results can also be found in our benchmark engine, Bench.
FCAT Processing: link
One of the more interesting workloads that has crossed our desks in recent quarters is FCAT - the tool we use to measure stuttering in gaming due to dropped or runt frames. The FCAT process requires enabling a color-based overlay onto a game, recording the gameplay, and then parsing the video file through the analysis software. The software is mostly single-threaded, however because the video is basically in a raw format, the file size is large and requires moving a lot of data around. For our test, we take a 90-second clip of the Rise of the Tomb Raider benchmark running on a GTX 980 Ti at 1440p, which comes in around 21 GB, and measure the time it takes to process through the visual analysis tool.
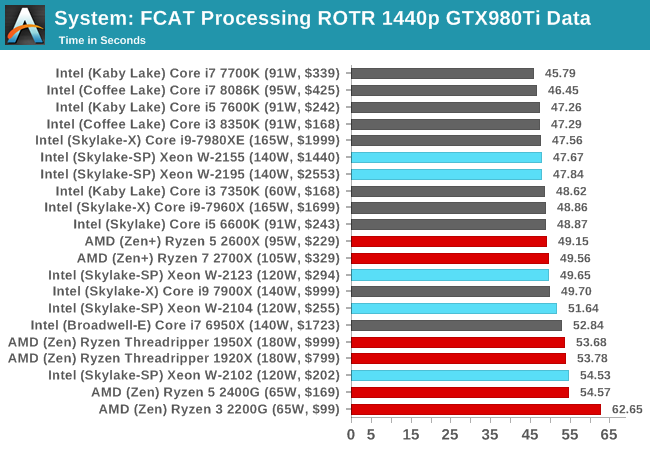
FCAT likes single threaded performance, whcih shows the high frequency parts with faster memory near the top.
Dolphin Benchmark: link
Many emulators are often bound by single thread CPU performance, and general reports tended to suggest that Haswell provided a significant boost to emulator performance. This benchmark runs a Wii program that ray traces a complex 3D scene inside the Dolphin Wii emulator. Performance on this benchmark is a good proxy of the speed of Dolphin CPU emulation, which is an intensive single core task using most aspects of a CPU. Results are given in minutes, where the Wii itself scores 17.53 minutes.
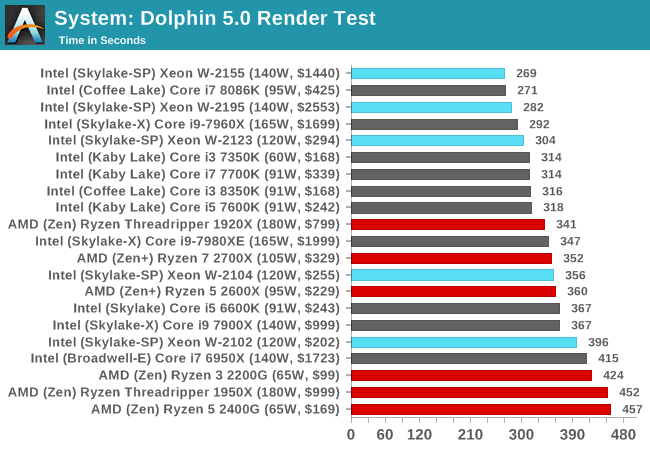
Dolphin is also pure ST frequency driven, however a surprise twist in that our Xeon W-2155 beats the Core i7-8086K in this test, although with a margin of error.
3D Movement Algorithm Test v2.1: link
This is the latest version of the self-penned 3DPM benchmark. The goal of 3DPM is to simulate semi-optimized scientific algorithms taken directly from my doctorate thesis. Version 2.1 improves over 2.0 by passing the main particle structs by reference rather than by value, and decreasing the amount of double->float->double recasts the compiler was adding in. It affords a ~25% speed-up over v2.0, which means new data.
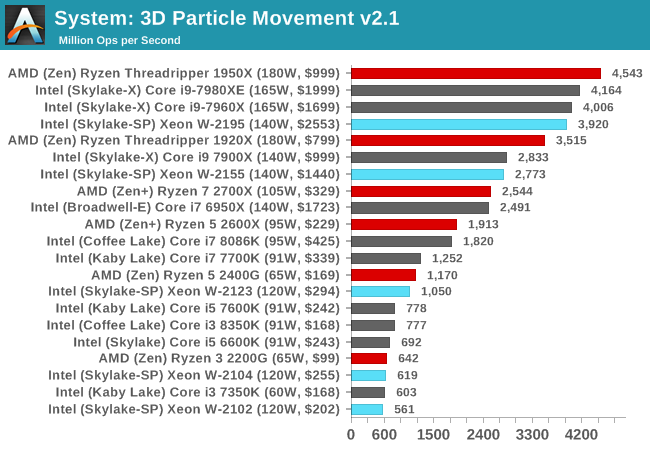
3DPM likes fast cache and frequency, and the W-2195 is almost fighting with the Core i9-7980XE here, and is let down slightly by its slow memory. The 1950X is still top dog.
DigiCortex v1.20: link
Despite being a couple of years old, the DigiCortex software is a pet project for the visualization of neuron and synapse activity in the brain. The software comes with a variety of benchmark modes, and we take the small benchmark which runs a 32k neuron/1.8B synapse simulation. The results on the output are given as a fraction of whether the system can simulate in real-time, so anything above a value of one is suitable for real-time work. The benchmark offers a 'no firing synapse' mode, which in essence detects DRAM and bus speed, however we take the firing mode which adds CPU work with every firing.
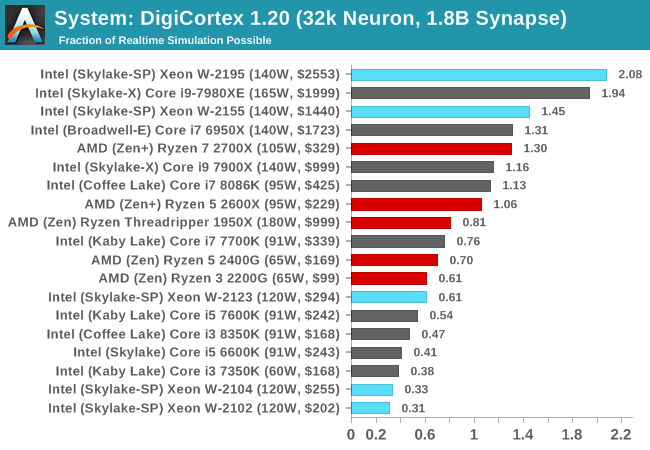
DigiCortex is a memory focused benchmark, but can also take advantage of AVX2 and sometimes AVX512, hence why the W-2195 is sat at the top. That being said, it is above the i9-7980XE, despite the latter having dual AVX512 ports.
Agisoft Photoscan 1.3.3: link
Photoscan stays in our benchmark suite from the previous version, however now we are running on Windows 10 so features such as Speed Shift on the latest processors come into play. The concept of Photoscan is translating many 2D images into a 3D model - so the more detailed the images, and the more you have, the better the model. The algorithm has four stages, some single threaded and some multi-threaded, along with some cache/memory dependency in there as well. For some of the more variable threaded workload, features such as Speed Shift and XFR will be able to take advantage of CPU stalls or downtime, giving sizeable speedups on newer microarchitectures.
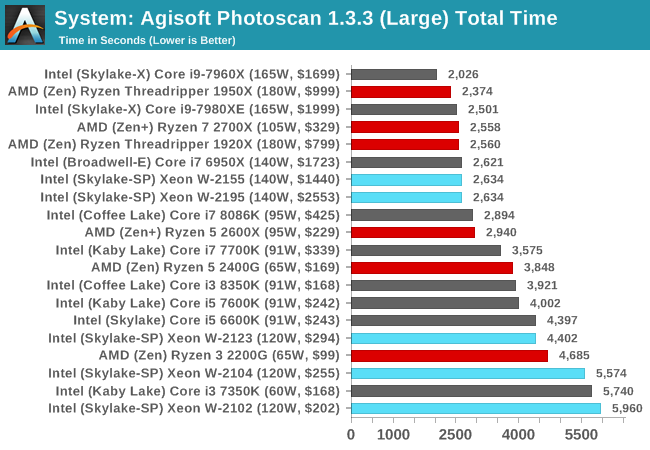
Agisoft is a mixture of workloads, although the big multithreaded bit in the middle tends to dominate. Both the W-2195 and W-2155 score the same time, with a cluster of results around it. The Core i9-7960X sits on top though, with a seemingly better mix of cores and threads.


74 Comments
View All Comments
Lolimaster - Tuesday, July 31, 2018 - link
I see no point in this when TR exist, not only 1950X already crushes but the 2990X will just made them an afterthought.cm2187 - Tuesday, July 31, 2018 - link
It says “workstation” but is there any reason not to base an entry level server on these specs? Cheaper than server chips, ample of ram, ECC, vpro. Is there anything Intel will do to enforce a segmentation?GreenReaper - Monday, August 6, 2018 - link
That is almost certainly one of the purposes of the custom 4-core editions. HP's MicroServer Gen8 had a two-core 2.3Ghz Celeron with ECC support - this has significantly more wattage but I'd expect to see it in hardware with a need for long-term highly-reliable duty like communications equipment.buxe2quec - Tuesday, July 31, 2018 - link
This may be a stupid question, but how come my E3-1220 (3.1 GHz) from 2011 has 80 W TDP and this Xeon W-2104 (first table) has 120 W?I thought that power consumption went down per MHz... this is 50% increase.
buxe2quec - Tuesday, July 31, 2018 - link
I saw the numbers on page 2 about the real tests, but I don't have the ones for the E3-1220 to compare the actual values, so I was comparing only nominal TDP.Hamm Burger - Tuesday, July 31, 2018 - link
I'm lucky enough to be using a 10-core iMac Pro, so have the Apple-specific W-2150B. I'm afraid I'm not about to prise it out of the system so that you can test it, but here's the result of one anecdotal test: running the CPU portion of Cinebench 15 for macOS gives a mutithreaded score of 2012 and single-threaded of 182 — a spot below your figures for the W-2195. Also, Intel Power Gadget shows the CPU drawing 150W, with the cores hitting almost 100° during the multithreaded test.abufrejoval - Tuesday, July 31, 2018 - link
I guess Intel wants to ensure AMD Threadripper gets the home-grown workstation market going forward…Like you mention, previous generation CPUs, even high core count variants are floating around in the second hand market and I got myself an OEM variant of the E5-2699v3 (E5-2696v) about two years back for around $700 from China via eBay (“extremely affordable”). That’s an 18core chip that will clock a little higher than the 2699, 3.6GHz instead of 3.3 when fewer cores are used, while the all-core clocks and TDP (145 Watts) are the same.
I am running this in an X99 board with 128GB of ECC UDIMM (bought before the RAM prices hiked 100%) and operating it with a BCLK overclock of 103.8, which results in a clean 4GHz for low-core workloads, 3.8GHz with four cores active and 2.8GHz for all-core unless it’s AVX workloads (prime95), where it may drop to 2.6GHz, all with well below 140 Watts and generally quite cool with an unnoticeable Noctua fan inside a $60 cheapo tower.
It runs games rather well, clocking high on the few cores most game engines use and it also does well using lots of cores on things like massive compile jobs (make -j40) or machine learning tasks (helped along by GTX 1080ti where GPUs are better).
It gets 2552 on Cinebench R15, so it won’t quite beat the current generation Threadrippers or these Xeons, but at the premium prices Intel wants to charge for Xeon-W as well as current DRAM prices, I simply couldn’t afford something in this league for the home-lab.
abufrejoval - Tuesday, July 31, 2018 - link
Here is a Geekbench result for this rig: https://browser.geekbench.com/v4/cpu/9220520alpha754293 - Thursday, August 2, 2018 - link
The other reason why someone might consider the Xeon W (such as myself) - high memory and need a very fast single threaded performance.The consumer parts are limited to 64 GB (ECC or not) of RAM whereas the Xeon W caps out at 512 GB.
Most "normal" people might not need that, but I can tell you right now that for some of the pre and post-processing work that I do, I'm looking now at either a 256 or 512 GB system with very fast single threaded performance.
Dug - Thursday, August 2, 2018 - link
I know you've heard it before, but just want to throw in my 2 cents.Could you please try a newer version of Handbrake for H.256 benchmarks. I know when doing comparisons you need consistency and it's best to stick with one version, but x265 is becoming very popular, and the new version fixes previous x265 issues. Plus they have new Production presets which might be helpful. Thanks for any consideration.